Advertisements
Advertisements
Question
Observe the following table and answer the questions:
Supply schedule of chocolates
| Price in ₹ | Quantity supplied in units |
| 10 | 200 |
| 15 | ______ |
| 20 | 300 |
| 25 | 350 |
| 30 | ______ |
| 35 | ______ |
| 40 | ______ |
- Complete the above supply schedule.
- Draw a diagram for the above supply schedule.
- State the relationship between price and quantity supplied.
Chart
Graph
Short Answer
Advertisements
Solution
a.
| Price in ₹ | Quantity supplied in units |
| 10 | 200 |
| 15 | 250 |
| 20 | 300 |
| 25 | 350 |
| 30 | 400 |
| 35 | 450 |
| 40 | 500 |
b.
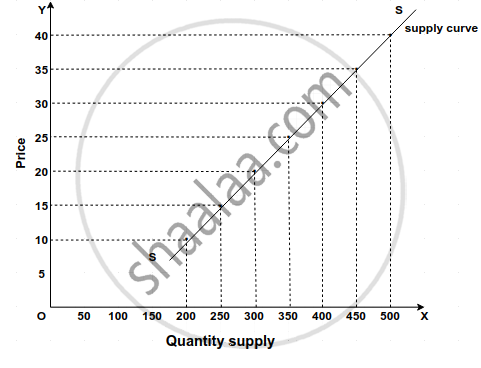
c.
- There is a direct relationship between price and quantity supplied.
- The supply curve is a positive slope.
- As the price increases quantity supplied also increases.
- At the lowest price, 10 quantity supplied is less than 200, at the highest price 40 the quantity supplied us the highest 500.
- The supply curve moves upward from left to right.
shaalaa.com
Is there an error in this question or solution?
