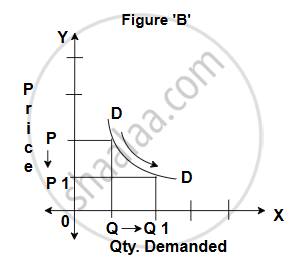
When a percentage change in price leads to a proportionate change in quantity demanded, then demand is said to be unitary elastic. For example, 50% fall in the price of a commodity leads to 50% rise in the quantity demanded.
In the given figure, when price falls from OP to OP1 (50%), demand rises from OQ to OQ1 (50%). Therefore, the slope of the demand curve is a ‘rectangular hyperbola’.
