Advertisements
Advertisements
Question
Observe the following table and transfer the information into a paragraph:
Statewise Distribution of Urban and Rural Population in India:
| States | Population in Millions | |
| Rural | Urban | |
| Maharashtra | 560 | 410 |
| Gujarat | 320 | 190 |
| Madhya Pradesh | 440 | 160 |
| Chhattisgarh | 170 | 40 |
| Andhra Pradesh | 550 | 210 |
| Karnataka | 350 | 180 |
Advertisements
Solution
Population in India
The table represents State wise Distribution of Urban and Rural Population in India. The first one in the table is Maharashtra where Rural population is 560 million whereas Urban population is 410 million. The next is Gujarat where Rural population is 320 million and Urban population is 190 million. The next is Madhya Pradesh where the Rural population is more 440 million and the Urban population is 160 million. After Madhya Pradesh comes Chhattisgarh where the Rural population is 170 million and the Urban population is the lowest that is 40 million. The next one is Andhra Pradesh where the Urban population is 550 million but Maharashtra is still ahead in this and the Urban population is 210 million. The last one is Karnataka where the Rural population is 350 million and the Urban population is 180 million. So overall, if we see there is a variance in distribution of Urban & Rural population in different states of India. When compared Maharashtra has the highest rural & urban population whereas Chhattisgarh has the lowest in both.
APPEARS IN
RELATED QUESTIONS
A1.Books have the power to inspire and do many more things. Observe the web diagram and convert the information into a paragraph. Add a few more points to the given information:

A2. Read the given information and fill the table provided:
Acclaimed in Indian classics as the Kalpavriksha, the all giving tree the coconut palm grows in several states in India. The coconut palm is member of the plant family Arecaceae popularly known as palm family. It flourishes on sandy soils requiring high humidity abundant sunlight and high rainfall for optimal growth. All parts of the palm are used in some way or another in the daily life of the people. Coconut water provides a refreshing and nutritious drink. The firm kernel that line the inside is high in calories and the white milk extracted from it is used in many different ways. Oil extracted from dried mature coconuts is used as cooking oil. The leaves are braided to make thatched roof and mats. The mid ribs of the leaves are dried and tied together to make brooms. The coconut shell and husk are good sources of efficient fuel. During religious ceremonies married women are often presented with a coconut along with a few grains of rice as a symbol of fertility and prosperity.
| Name : | |
| Scientific name : | |
| Place where grown : | |
| Climate required : | |
| Uses : | |
| (a) Liquid | |
| (b) Kernel | |
| (c) Leaves | |
| (d) Shell | |
| Symbolises : |
Question:
Read the following graph regarding ‘High Awareness but Little Action’ about organ donation. Write a paragraph based on it in about 120 words:
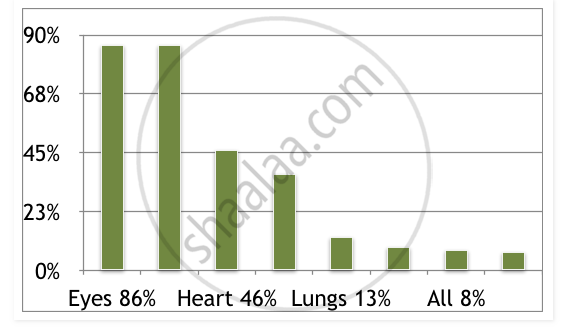
Look at the graph and the paragraph below which provides an interpretation of the data given in the graph.
Graph to show number of whales caught in Antarctic (1985-2010)

As whalers reduced catching of the large/r whales, they switched to smaller species. This is evident when we compare figures for the Antarctic catch of the larger sei whale with those for small minke whale. In 1985, fifteen times as many sei whales as minke whales were caught. By 1995, catches of both the species were virtually the same (9000). By the 2000, the situation had reversed and the number of minke whales killed more than doubled as compared to sei whales (6000). The graph shows that while the sei catch was reduced by 95% between 1985 and 2010, over the same period the minke whale catch was eight times greater. If these trends continue, the situation for the smaller species will be as bad as it used to be for the larger ones.
Discuss with a partner:
1. What expressions have been used for comparing the data? Underline them.
2. Does the analysis identify the main trends? Has any projection or guess been made based on the available data?
3. Can you spot a sentence that summarizes the data or draws a conclusion based on it?
4. Has the analysis been supported with figures from the given data?
5. Is there any unnecessary repetition?
6. How many times has the verb 'be' in its different forms been used? Some useful expressions :
|
{much ,many, far ,slightly, a little} |
more, greater,higher, less, lower, further, farther |
|
{half, twice, ten times, (etc.)} |
as { adj. adv.} as |
|
10 percent 150 percent |
{more less } than |
| almost the same ____ as | |
| as {adj adv.} as |
Read the following information and prepare a pie diagram for the same.
Annual Water Usage in Maharashtra
Water is life. It is a universal solvent and an important resource. The annual usage of water differs in various sectors of Maharashtra. The major occupation of Maharashtra being agriculture, the maximum amount of available water is used for irrigation that is 86%. The distant following place 7% is contributed by domestic sector including drinking, washing, cooking, etc. There is a close competition of other sectors which is not far away with 6% usage of water. One of the key factors which plays an important role in the development of a nation is industrial sector. The consumption of water by industrial sector is very negligible which is 1%. We know energy sector plays a vital role in the development of a nation.
In this sector, the use of water is almost nil. If we try to observe its place in the chart we do realise that it holds 0% usage and is yet to open its account.
Read the following passage and complete the table
Dialect is a form of a language spoken in one area which may be different from other forms of the same language. Each language has dialects which change every few kilometers. India is a multi-lingual country. Each state follows its own language as official language. For example, Marathi is the official language of Maharashtra, while Ahirani, Wharadi, Konkani and Malwani are its dialects. Several languages in India are spoken but do not have any script. In Karnataka, Kannada is the official language. Tulu is spoken in Karnataka but has no script. In England, English is the official language while Scottish, spoken in Scotland and Welsh spoken in Wales are dialects of English.
| State | Official language | Dialects | Spoken/ Without script |
| Maharashtra | Marathi | ||
| Karnataka | |||
| England |
Transfer the information into a paragraph about ‘Average Annual Tea Consumption Per Person’ as shown in the table given below :
| Nation | Turkey | Ireland | United Kingdom | Russia | Morocco | China | India |
| Tea consumption per person ( in Kg) | 3.15 | 2.19 | 1.94 | 1.38 | 1.21 | 0.57 | 0.32 |
Write two short paragraphs on ‘Village life’ by using the points given in the following web diagram:

A group of enterprising young adults conducted a survey on reopening of educational institutions in the National Capital.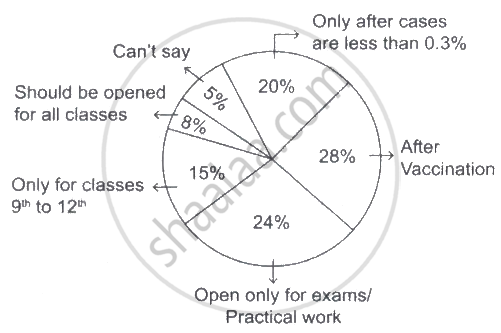
Write a paragraph in about 120 words analysing the listed responses.
Given below is a web diagram containing information about the different means of electronic devices of entertainment-some audio, some visual and some audio-visual.
Write a short paragraph based on information from the web. Give a suitable title to it.

Non-verbal to verbal:
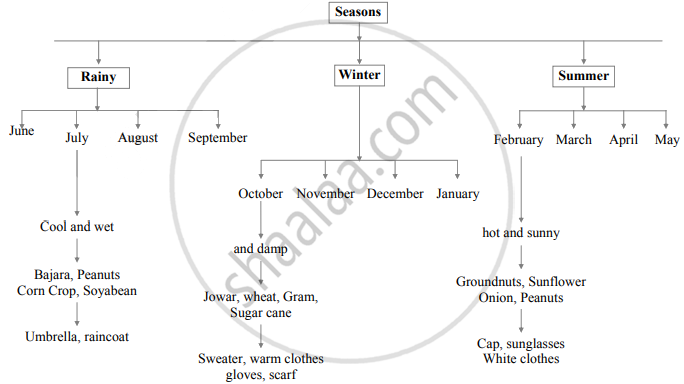
Read the information given in the following tree-diagram and write two short paragraphs based on it. Give a suitable title to your write up: