Advertisements
Advertisements
Question
(a) Name the two growth models that represent population growth and draw the respective growth curves they represent.
(b) State the basics for the difference in the shape of these curves
(c) Which one of the curves represents the human population growth at present? Do you think such a curve is sustainable? Give reason in support of your answer.
Advertisements
Solution
(a) Two types of growth models:
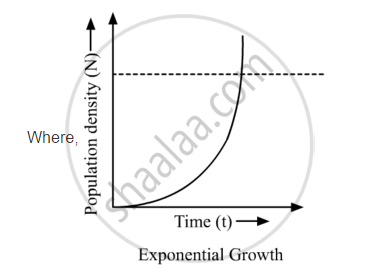
1) Exponential growth: When resources are unlimited, the population tends to grow in an exponential pattern. If the population size is N and the birth and death rates are b and d, respectively, then the increase or decrease in N at t (time period) is
dN/dt=(b-d)*N
if (b-d)=r, then
dN/dt=rN
r is the intrinsic rate of natural increase.
Or
Nt=Nοert
Nt: Population density at time t
N0: Population density at time 0
r: Intrinsic rate of natural increase
e: Base of natural logarithm (2.71828)
2) Logistic growth: When the resources are limited leading to competition between individuals and survival of the fittest, the population tends to grow logistically. In this kind of growth, there is an initial lag phase followed by acceleration or deceleration phases, and finally asymptote, when it reaches its carrying capacity (K). When N in relation to t is plotted, it results in a sigmoid curve which is
dN/dt=rN`((K-N)/K)`
N: Population density at time t
r: Intrinsic rate of natural increase
K: Carrying capacity
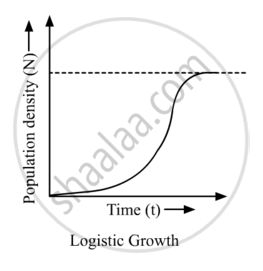
(b) The difference in the shape of these curves is the amount of resources available for the given population. For exponential growth, the amount of resources is considered infinite, while in logistic growth, there is limited amount of resources available.
(c) The present human population is following the logistic growth curve because the number of human beings is increasing rapidly but the available resources are not increasing at the same pace. Such a growth pattern is not sustainable because at one point the human population would reach a place where there would not be enough resources for everyone. For sustainable growth, we must find ways to develop and use already present resources more intelligently.
