Advertisements
Advertisements
Question
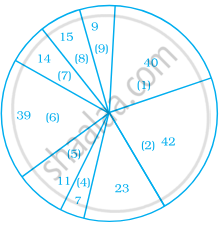
Following is a pie chart showing the amount spent in rupees (in thousands) by a company on various modes of advertising for a product.
Now answer the following questions.
- Which type of media advertising is the greatest amount of the total?
- Which type of media advertising is the least amount of the total?
- What percent of the total advertising amount is spent on direct mail campaigns?
- What percent of the advertising amount is spent on newspaper and magazine advertisements?
- What media types do you think are included in miscellaneous? Why aren’t those media types given their own category?
- Television
- Newspapers
- Magazines
- Radio
- Business papers
- Direct mail
- Yellow pages
- Outdoor
- Miscellaneous
Sum
Advertisements
Solution
1. The greatest amount of total is spent in Newspapers.
2. The greatest amount of total is spent in Radio.
3. Total = 40 + 42 + 23 + 7 + 11 + 39 + 14 + 15 + 9 = 200
% Spent in direct mail = `39/200 xx 100`
% Spent in direct mail = 19.5
4. Total = 40 + 42 + 23 + 7 + 11 + 39 + 14 + 15 + 9 = 200
Newspaper + Magazine = 42 + 23 = 65
% Spent in Newspaper and Magazine = `65/200 xx 100`
% Spent in Newspaper and Magazine = 32.5
5. The various media types on which not much amount is spent must be included in Miscellaneous.
shaalaa.com
Is there an error in this question or solution?
