Advertisements
Advertisements
Question
Find out from your classmates and fill the table.
| Main food | Number of persons |
| Rice | |
| Wheat | |
Look at the table and tell :
- Most children eat food made from ______
- Compared to children who eat rice, those who eat wheat are more/less/equal.
- Compare to those who eat wheat, children eating ragi are more/less.
Answer in Brief
Advertisements
Solution
The table is given as follows:
| Main Food | Number of persons |
| Rice | 25 |
| Wheat | 24 |
| Maize | 2 |
| Barley | 3 |
| Ragi | 1 |
- Most children eat food made from rice.
- More children eat food made from rice than wheat.
- The number of children who eat wheat are more than who eat food made of ragi.
shaalaa.com
Smart Charts
Is there an error in this question or solution?
APPEARS IN
RELATED QUESTIONS
How much time do we spend in this?
Some children were asked which of these they liked most-Tea, Coffee or Milk.
| The Drink they like | Number of children |
| Milk | 20 |
| Coffee | 10 |
| Tea | 10 |
- Total number of children ______
- Children who like milk are `1/2`/ `1/4` of the total children.
- Children who like coffee are `1/2`/`1/4` of the total children.
- Show the liking for Tea, Coffee or Milk in a Chapati Chart.
| Face of the die | Number of times ( / for each throw) |
 |
| | | | | |
 |
| | | |
 |
| | | | | |
 |
| | | | |
 |
| | | | | | | |
 |
| | | | | | |
How many times did come up? ______ times
| Face of the die | Number of times ( / for each throw) |
|
| | | | | |
|
| | | |
|
| | | | | |
|
| | | | |
|
| | | | | | | |
|
| | | | | | |
came up more number of times than ______.
| Favourite sweet | Number of people |
| Jalebi | 20 |
| Rasgulla | 18 |
| Jamun | 25 |
| Laddoo | 22 |
| Burfi | 17 |
| Kalakand | 15 |
Least favourite sweet ______
| Number of people living together | How many families |
| 1 alone | 2 |
| 2 people | 5 |
| 3 people | 8 |
| 4 people | 6 |
| 5 people | 4 |
| 6 people | 2 |
| 7 people | 2 |
| 8 people | 1 |
The least number of people living in a home is ______
| Absent Students' Chart | |
| Class | Absent student |
| Class I |   |
| Class II |  |
| Class III |    |
| Class IV |     |
| Class V |   |
Now look at the chart and fill in the blanks:
The number of students absent in Class IV and Class V are ______ and ______.

Look at the picture and fill in the table.
| Way of coming | Tractor | ______ | ______ | ______ |
| Number of students | 3 | ______ | ______ | ______ |
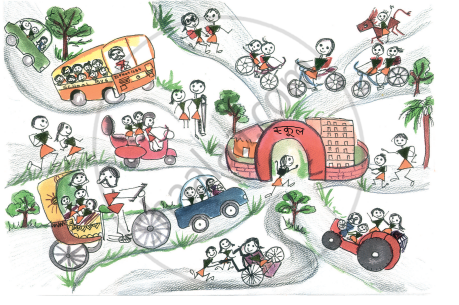 Fill in the blanks:
The number of students walking to school is ______ than the students coming on bicycle.
| Vegetable disliked | Number of students |
| Onion | 2 |
| Tomato | 3 |
| Brinjal | 4 |
| Ladyfinger | 2 |
| Potato | 1 |
The vegetable disliked by very few children is ______.
