Advertisements
Advertisements
Question
Find graphical solution for following system of linear inequations :
3x + 2y ≤ 180; x+ 2y ≤ 120, x ≥ 0, y ≥ 0
Hence find co-ordinates of corner points of the common region.
Advertisements
Solution
We plot the lines l1 = 3x + 2y = 180 and l2 = x + 2y = 120
For l1
| x | y | Points |
| 60 | 0 | A(60, 0) |
| 0 | 90 | B(0, 90) |
For l2
| x | y | Points |
| 120 | 0 | C( 120, 0 ) |
| 0 | 60 | D( 0, 60 ) |
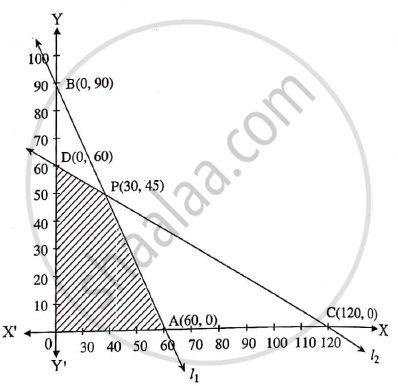
The shaded region is the quadrilateral OAPD and it is the common solution set, where P is the point of intersection of l1 and l2 Solving
3x + 2y = 180
x + 2y = 120
- - -
∴ 2x = 60
∴ x = 30
∴ 30 + 2y = 120
∴ y = 45
P ( 30, 45 )
Corner points 0(0, 0), A(60, 0). P(30, 45), D(O, 60)
APPEARS IN
RELATED QUESTIONS
The equations given of the two regression lines are 2x + 3y - 6 = 0 and 5x + 7y - 12 = 0.
Find:
(a) Correlation coefficient
(b) `sigma_x/sigma_y`
Given that the observations are: (9, -4), (10, -3), (11, -1), (12, 0), (13, 1), (14, 3), (15, 5), (16, 8). Find the two lines of regression and estimate the value of y when x = 13·5.
Find the equation of the regression line of y on x, if the observations (x, y) are as follows :
(1,4),(2,8),(3,2),(4,12),(5,10),(6,14),(7,16),(8,6),(9,18)
Also, find the estimated value of y when x = 14.
If Σx1 = 56 Σy1 = 56, Σ`x_1^2` = 478,
Σ`y_1^2` = 476, Σx1y1 = 469 and n = 7, Find
(a) the regression equation of y on x.
(b) y, if x = 12.
From the data of 20 pairs of observations on X and Y, following results are obtained.
`barx` = 199, `bary` = 94,
`sum(x_i - barx)^2` = 1200, `sum(y_i - bary)^2` = 300,
`sum(x_i - bar x)(y_i - bar y)` = –250
Find:
- The line of regression of Y on X.
- The line of regression of X on Y.
- Correlation coefficient between X and Y.
bYX is ______.
The equation of the line of regression of y on x is y = `2/9` x and x on y is x = `"y"/2 + 7/6`.
Find (i) r, (ii) `sigma_"y"^2 if sigma_"x"^2 = 4`
Regression equation of X on Y is_________
In the regression equation of Y on X, byx represents slope of the line.
Choose the correct alternative:
The slope of the line of regression of y on x is called the ______
Choose the correct alternative:
If the lines of regression of Y on X is y = `x/4` and X on Y is x = `y/9 + 1` then the value of r is
Choose the correct alternative:
y = 5 – 2.8x and x = 3 – 0.5 y be the regression lines, then the value of byx is
State whether the following statement is True or False:
y = 5 + 2.8x and x = 3 + 0.5y be the regression lines of y on x and x on y respectively, then byx = – 0.5
Among the given regression lines 6x + y – 31 = 0 and 3x + 2y – 26 = 0, the regression line of x on y is ______
The equations of the two lines of regression are 6x + y − 31 = 0 and 3x + 2y – 26 = 0. Calculate the mean values of x and y
If `(x - 1)/l = (y - 2)/m = (z + 1)/n` is the equation of the line through (1, 2, -1) and (-1, 0, 1), then (l, m, n) is ______
If `bar"X"` = 40, `bar"Y"` = 6, σx = 10, σy = 1.5 and r = 0.9 for the two sets of data X and Y, then the regression line of X on Y will be:
For certain bivariate data on 5 pairs of observations given:
∑x = 20, ∑y = 20, ∑x2 = 90, ∑y2 = 90, ∑xy = 76 then bxy = ______.
