Advertisements
Advertisements
प्रश्न
Find graphical solution for following system of linear inequations :
3x + 2y ≤ 180; x+ 2y ≤ 120, x ≥ 0, y ≥ 0
Hence find co-ordinates of corner points of the common region.
Advertisements
उत्तर
We plot the lines l1 = 3x + 2y = 180 and l2 = x + 2y = 120
For l1
| x | y | Points |
| 60 | 0 | A(60, 0) |
| 0 | 90 | B(0, 90) |
For l2
| x | y | Points |
| 120 | 0 | C( 120, 0 ) |
| 0 | 60 | D( 0, 60 ) |
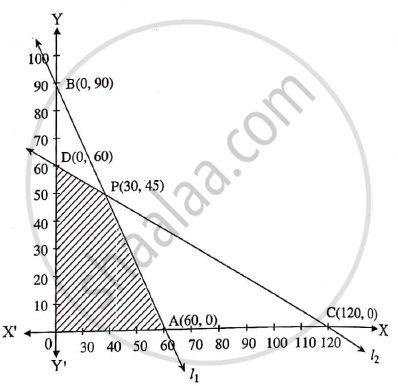
The shaded region is the quadrilateral OAPD and it is the common solution set, where P is the point of intersection of l1 and l2 Solving
3x + 2y = 180
x + 2y = 120
- - -
∴ 2x = 60
∴ x = 30
∴ 30 + 2y = 120
∴ y = 45
P ( 30, 45 )
Corner points 0(0, 0), A(60, 0). P(30, 45), D(O, 60)
APPEARS IN
संबंधित प्रश्न
Identify the regression equations of X on Y and Y on X from the following equations :
2x + 3y = 6 and 5x + 7y – 12 = 0
Find the equation of the regression line of y on x, if the observations (x, y) are as follows :
(1,4),(2,8),(3,2),(4,12),(5,10),(6,14),(7,16),(8,6),(9,18)
Also, find the estimated value of y when x = 14.
If Σx1 = 56 Σy1 = 56, Σ`x_1^2` = 478,
Σ`y_1^2` = 476, Σx1y1 = 469 and n = 7, Find
(a) the regression equation of y on x.
(b) y, if x = 12.
For the given lines of regression, 3x – 2y = 5 and x – 4y = 7, find:
(a) regression coefficients byx and bxy
(b) coefficient of correlation r (x, y)
Identify the regression equations of x on y and y on x from the following equations, 2x + 3y = 6 and 5x + 7y − 12 = 0
From the two regression equations y = 4x – 5 and 3x = 2y + 5, find `bar x and bar y`.
Regression equation of X on Y is ______
Choose the correct alternative:
The slope of the line of regression of y on x is called the ______
Choose the correct alternative:
u = `(x - 20)/5` and v = `(y - 30)/4`, then bxy =
Choose the correct alternative:
y = 5 – 2.8x and x = 3 – 0.5 y be the regression lines, then the value of byx is
State whether the following statement is True or False:
The equations of two regression lines are 10x – 4y = 80 and 10y – 9x = 40. Then bxy = 0.9
State whether the following statement is True or False:
y = 5 + 2.8x and x = 3 + 0.5y be the regression lines of y on x and x on y respectively, then byx = – 0.5
State whether the following statement is True or False:
If equation of regression lines are 3x + 2y – 26 = 0 and 6x + y – 31= 0, then mean of X is 7
State whether the following statement is True or False:
bxy is the slope of regression line of y on x
The equations of the two lines of regression are 2x + 3y − 6 = 0 and 5x + 7y − 12 = 0. Identify the regression lines
The equations of the two lines of regression are 6x + y − 31 = 0 and 3x + 2y – 26 = 0. Calculate the mean values of x and y
Two samples from bivariate populations have 15 observations each. The sample means of X and Y are 25 and 18 respectively. The corresponding sum of squares of deviations from means are 136 and 148 respectively. The sum of product of deviations from respective means is 122. Obtain the regression equation of x on y
For certain bivariate data on 5 pairs of observations given:
∑x = 20, ∑y = 20, ∑x2 = 90, ∑y2 = 90, ∑xy = 76 then bxy = ______.
Out of the two regression lines x + 2y – 5 = 0 and 2x + 3y = 8, find the line of regression of y on x.
