Advertisements
Advertisements
Question
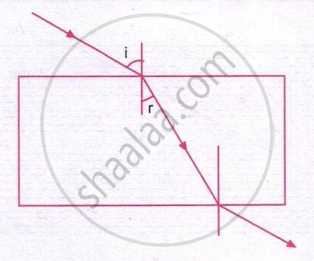
Fig illustrates an experiment to determine the refractive index of glass. Which one of the following graphs would give a straight line through the origin?
Options
∠i plotted against ∠r.
sin i plotted against ∠r.
∠i plotted against sin D.
sin i plotted against sin r.
`1/(∠"i") " plotted against" 1/(∠"r")`.
MCQ
Advertisements
Solution
sin i plotted against sin r
Explanation:
The experiment is used to determine the refractive index of glass. According to Snell’s law:
\[ n=\frac{\sin i}{\sin r} \]
where,
\(i\) = angle of incidence
\(r\) = angle of refraction
\(n\) = refractive index of glass (constant)
Rearranging:
\[ \sin i = n \sin r \]
This shows that:
\[ \sin i \propto \sin r \]
Therefore, if we plot:
- Y-axis: \(\sin i\)
- X-axis: \(\sin r\)
the graph will be a straight line passing through the origin.
shaalaa.com
Is there an error in this question or solution?
