Advertisements
Advertisements
Question
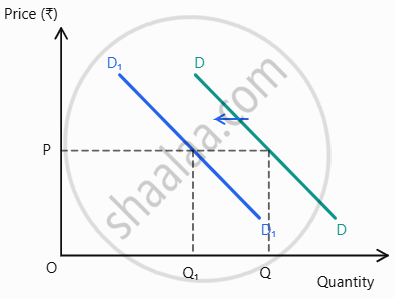
Explain with the help of diagram, the effect of the following change on the demand of a commodity:
Fall in the price of substitute good
Diagram
Explain
Advertisements
Solution
The substitute becomes more attractive relative to the given commodity, so demand for the given commodity falls at every price. Its demand curve shifts leftward. For example, if coffee becomes cheaper, demand for tea may fall.
shaalaa.com
Is there an error in this question or solution?
