Advertisements
Advertisements
Question
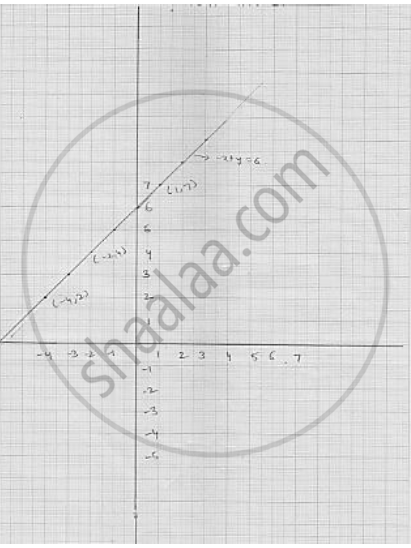
Draw the graph of the following linear equation in two variable : –x + y = 6
Advertisements
Solution
We have
- x + y = 6
⇒ x = 6 + x
Putting y = - 4 , we get y = 6 - 4 = 2
Putting x = - 3 we get y = 6 - 3 = 3
Thus, we get the following table giving the two points on the line represented by the
equation - x + y = 6
Graph for the equation - x + y = 6
shaalaa.com
Is there an error in this question or solution?
