Advertisements
Advertisements
Question
Draw the graph of the following linear equations in two variables:
x – y = 2
Graph
Advertisements
Solution
x − y = 2
Rewrite the equation as,
⇒ y = x − 2 ...(1)
By substituting the different values of x in the equation (1) we get different values for y.
When x = 0, we have y = 0 − 2 = − 2
When x = 2, we have y = 2 − 2 = 0
When x = 4, we have y = 4 − 2 = 2
Thus, we have the following table with all the obtained solutions:
| x | 0 | 2 | 4 |
| y | −2 | 0 | 2 |
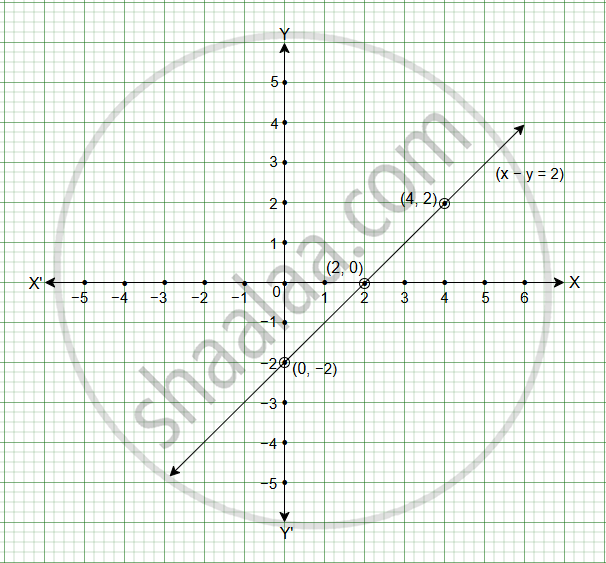
By Plotting the points (0, –2), (2, 0) and (4, 2) on the graph paper and drawing a line joining the corresponding points, we obtain the Graph.
The graph of the line represented by the given equation is as shown.
shaalaa.com
Is there an error in this question or solution?
