Advertisements
Advertisements
Question
Draw a histogram for the following frequency distribution:
| Train fare | 0 - 50 | 50 - 100 | 100 - 150 | 150 - 200 | 200 - 250 | 250 - 300 |
| No. of travellers | 25 | 40 | 36 | 20 | 17 | 12 |
Graph
Advertisements
Solution
This is an exclusive frequency distribution. We represent the class limits on the x-axis on a suitable scale and the frequencies on the y-axis on a suitable scale. Taking class intervals as bases and the corresponding to obtain a histogram of the given frequency distribution.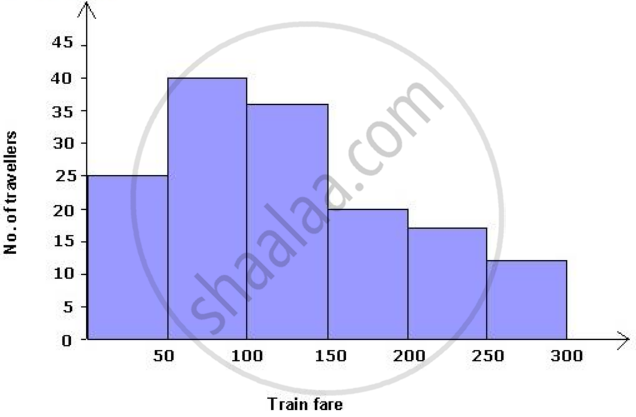
shaalaa.com
Graphical Representation of Continuous Frequency Distribution
Is there an error in this question or solution?
