Advertisements
Advertisements
Question
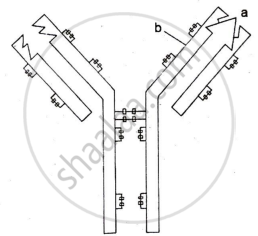
- What does the above diagram illustrate?
- Name the labelled ‘a’ and ‘b’.
- Name the type of cells that produces this molecule.
Very Short Answer
Advertisements
Solution
- The above diagram illustrates an immunoglobulin antibody molecule.
-
- Antigen-binding site (variable region)
- Constant region (heavy chain region)
- This molecule (antibody) is produced by plasma cells, which are specialized B-lymphocytes (B-cells).
shaalaa.com
Is there an error in this question or solution?
