Advertisements
Advertisements
Question
(a) Sketch a graph to show the change in potential difference across the ends of an ohmic resistor and the current flowing in it. Label the axes of your graph.
(b) What does the slope of the graph represent?
Diagram
Short Answer
Advertisements
Solution
(a) For an ohmic resistor, plot current (I) on the horizontal axis and potential difference (V) on the vertical axis. The graph is a straight line through the origin:
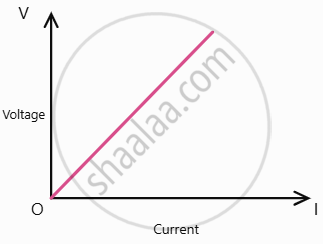
(b) The slope of this (V)-versus-(I) graph represents the resistance:
\[\text{slope}=\frac{\Delta V}{\Delta I}\]
= R
shaalaa.com
Is there an error in this question or solution?
