Advertisements
Advertisements
Question
A series combination of an inductor (L), capacitor (C) and a resistor (R) is connected across an ac source of emf of peak value E0, and angular frequency (ω). Plot a graph to show variation of impedance of the circuit with angular frequency (ω).
Graph
Very Short Answer
Advertisements
Solution
The graph showing the variation of impedance (Z) of the circuit with angular frequency (ω) is shown below:
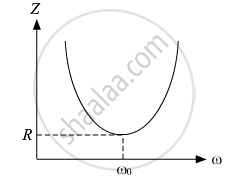
Here, ω0 represents the resonance frequency for the LCR circuit, and R is the resistance of the circuit.
shaalaa.com
Is there an error in this question or solution?
