Advertisements
Advertisements
Question
A mathematics aptitude test of 50 students was recored as follows:
| Marks | No. of students |
| 50-60 | 4 |
| 60-70 | 8 |
| 70-80 | 14 |
| 80-90 | 19 |
| 90-100 | 5 |
Draw a histrogram for the above data using a graph paper and locate the mode.
Graph
Advertisements
Solution
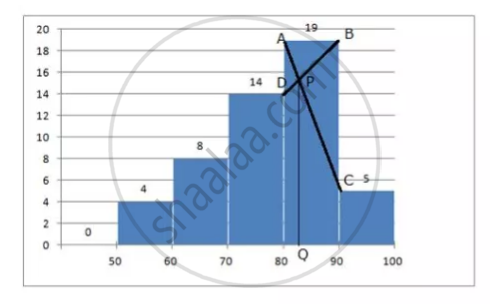
- Draw the histogram
- In the highest rectangle which represents modal class draw two lines AC and BD intersecting at P
- From P, draw a perpendicular to x-axis meeting at Q
- Value of Q is the mode = 82 (approx)
shaalaa.com
Is there an error in this question or solution?
