Advertisements
Advertisements
Question
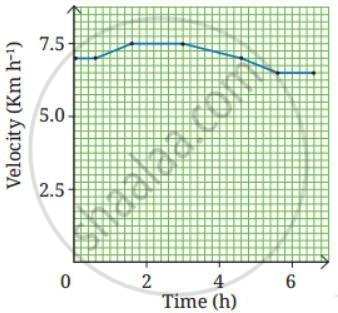
A girl is preparing for her first marathon by running on a straight road. She uses a smartwatch to calculate her running speed at different intervals. The graph (Fig.) depicts her velocity versus time. Estimate the running distance based on the graph.
Advertisements
Solution
The area between the time axis and the velocity-time graph equals the running distance.
Examining the graph’s main features and figuring out each segment’s area:
| Segment | Time (h) | Velocity (Km h−1) |
| Start | 0 ⟶ 0.6 | 7.0 |
| Rising | 0.6 ⟶ 1.6 | 7.0 ⟶ 7.5 |
| Steady | 1.6 ⟶ 3.0 | 7.5 |
| Falling | 3.0 ⟶ 4.6 | 7.5 ⟶ 7.0 |
| Slowing | 4.6 ⟶ 5.6 | 7.0 ⟶ 6.5 |
| End | 5.6 ⟶ 6.6 | 6.5 |
In this case, the area provides the distance in kilometres since the time is in hours and the velocity is in km/h−1.
Running distance is the total of the areas under the velocity-time graph at various time intervals.
= Area of rectangle (0 h ⟶ 0.6 h) + Area of trapezium (0.6 h ⟶ 1.6 h) + Area of rectangle (1.6 h ⟶ 3.0 h) + Area of trapezium (3.0 h ⟶ 4.6 h) + Area of trapezium (4.6 h ⟶ 5.6 h) + Area of rectangle (5.6 h ⟶ 6.6 h)
= `(0.6 - 0) xx 7.0 + 1/2 xx (7.0 + 7.5) xx (1.6 - 0.6) + (3.0 - 1.6) xx 7.5 + 1/2 xx (7.5 + 7.0) xx (4.6 - 3.0) + 1/2 xx (7.0 + 6.5) xx (5.6 - 4.6) + (6.6 - 5.6) xx 6.5`
= 0.6 × 7.0 + 0.5 × 14.5 × 1.0 + 1.4 × 7.5 + 0.5 × 14.5 × 1.6 + 0.5 × 13.5 × 1.0 + 1.0 × 6.5
= 4.2 + 7.25 + 10.5 + 11.6 + 6.75 + 6.5
= 46.8 km
Hence, the estimated running distance is approximately 46.8 km.
