Advertisements
Advertisements
प्रश्न
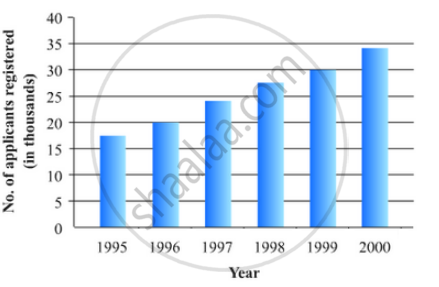
The following data gives the number (in thousands) of applicants registered with an
| Year | 1995 | 1996 | 1997 | 1998 | 1999 | 2000 |
| Number of applicants registered (in thousands) | 18 | 20 | 24 | 28 | 30 | 34 |
Construct a bar graph to represent the above data.

Advertisements
उत्तर
To represent the given data by a vertical bar graph, we first draw horizontal and vertical axes. Let us consider that the horizontal and vertical axes represent the years and the number of applicants registered in thousands respectively. We have to draw 6 bars of different lengths given in the table.
At first we mark 6 points in the horizontal axis at equal distances and erect rectangles of the same width at these points. The heights of the rectangles are proportional to the number of applicants registered.
The vertical bar graph of the given data is following:
APPEARS IN
संबंधित प्रश्न
Read the bar graph given in Fig. below and answer the following questions:

(i) What information does it give?
(ii) In which part the expenditure on education is maximum in 1980?
(iii) In which part the expenditure has gone up from 1980 to 1990?
(iv) In which part the gap between 1980 and 1990 is maximum?
The following data gives the value (in crores of rupees) of the Indian export of cotton textiles for different years:
| Years | 1982 | 1983-1984 | 1984-1985 | 1985-1986 | 1986-1987 |
| Value of Export of Cotton Textiles (in crores of rupees) |
300 | 325 | 475 | 450 | 550 |
Represent the above data with the help of a bar graph. Indicate with the help of a bar graph the year in which the rate of increase in exports is maximum over the preceding year.
The following tables gives the quantity of goods (in crore tonnes)
| Year | 1950-51 | 1960-61 | 1965-66 | 1970-71 | 1980-81 | 1982-83 |
| Quantity of Goods (in crore tonnes) |
9 | 16 | 20 | 20 | 22 | 26 |
Explain through the bar graph if the quantity of goods carried by the Indian Railways in 1965-66 is more than double the quantity of goods carried in the year 1950-51.
The expenditure (in 10 crores of rupees) on health by the Government of India during the various five year plans is shown below:
| Plans: | I | II | III | IV | V | VI |
| Expenditure on health (in 10 crores of rupees) |
7 | 14 | 23 | 34 | 76 | 182 |
Construct a bar graph to represent the above data.
The time taken, in seconds, to solve a problem by each of 25 pupils is as follows:
16, 20, 26, 27, 28, 30, 33, 37, 38, 40, 42, 43, 46, 46, 46, 48, 49, 50, 53, 58, 59, 60, 64, 52, 20
(a) Construct a frequency distribution for these data, using a class interval of 10 seconds.
(b) Draw a histogram to represent the frequency distribution.
The following table shows the market position of different brands of tea-leaves.
| Brand | A | B | C | D | others |
| % of Buyers | 35 | 20 | 20 | 15 | 10 |
Draw it-pie-chart to represent the above information.
In the following figure, there is a histogram depicting daily wages of workers in a factory. Construct the frequency distribution table.

Draw a histogram of the following distribution:
| Heights (in cm) | Number of students |
| 150 – 153 | 7 |
| 153 – 156 | 8 |
| 156 – 159 | 14 |
| 159 – 162 | 10 |
| 162 – 165 | 6 |
| 165 – 168 | 5 |
The lengths of 62 leaves of a plant are measured in millimetres and the data is represented in the following table:
| Length (in mm) | Number of leaves |
| 118 – 126 | 8 |
| 127 – 135 | 10 |
| 136 – 144 | 12 |
| 145 – 153 | 17 |
| 154 – 162 | 7 |
| 163 – 171 | 5 |
| 172 – 180 | 3 |
Draw a histogram to represent the data above.
Following table shows a frequency distribution for the speed of cars passing through at a particular spot on a high way:
| Class interval (km/h) | Frequency |
| 30 – 40 | 3 |
| 40 – 50 | 6 |
| 50 – 60 | 25 |
| 60 – 70 | 65 |
| 70 – 80 | 50 |
| 80 – 90 | 28 |
| 90 – 100 | 14 |
Draw the frequency polygon representing the above data without drawing the histogram.
