Advertisements
Advertisements
प्रश्न
Observe the following web diagram carefully and convert it into a paragraph.

Advertisements
उत्तर
Problems faced by birds
Due to the loss of habitat, prey and heavy hunting for meats, some of the Indian birds are on the verge of extinction. The life of birds is no more a bed of roses for they face various problems during their existence on the earth. Poaching and massive hunting took these beautiful species birds into the category of critically endangered birds of India. Their natural habitat - forests - are being cleared away to provide for human settlements, thus encroaching upon their space. Great Indian bustard, Indian Vulture, Himalayan quail, and Siberian Crane are few species of birds who are facing critical problems of extinction. Many birds are caught and caged and this prevents their breeding in natural circumstances. Further, due to the shrinking of water bodies, birds are almost dying for want of water and food. Deforestation is another major offender of birds and a threat to their existence. The exciting and fun-filled kite flying provides children and often adults with much joy and thrill, but does one realize the injuries inflicted on birds when they come in contact with the manga. A study by the International Crane Foundation said the last confirmed sighting of Siberian cranes in India was in 2002. Another report states that in 1974 close to 75 birds wintered in Bharatpur which declined to a single pair in 1992. In more recent times, the setting up of mobile towers are causing much harm to the birds by the radiation.
APPEARS IN
संबंधित प्रश्न
Information Transfer Non-Verbal to Verbal :
Observe the following web-chart carefully and write two short paragraphs of ‘Advantages of watching Television’ with the help of the points given.
A survey was conducted among the teachers of New Hope High School to find out whether Class X students should be allowed to use mobile phones in the campus. The results of the survey are shown in the pie-chart below.

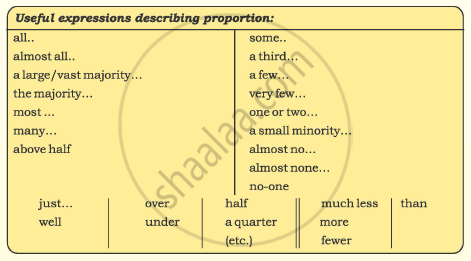
Look at the pie chart and the useful expressions above. Fill in the gaps in the following summary of results.
As can be seen from the above pie-chart, nearly a__________ of the teachers felt that Class X students must not be allowed to use mobile phones in the school campus. However, nearly one____________ believed
the phones should be permitted but not during class hours. About __________were of the opinion that the students may be allowed to use these phones only in times of emergency while a very__________ did not favour any restrictions on their use in the campus.
Read the following tree-diagram and prepare a short paragraph regarding 'Soil Erosion'.

Do anyone of the following activities.
Transfer the given information into a paragraph.
Transfer the information into a paragraph about ‘Average Annual Tea Consumption Per Person’ as shown in the table given below :
| Nation | Turkey | Ireland | United Kingdom | Russia | Morocco | China | India |
| Tea consumption per person ( in Kg) | 3.15 | 2.19 | 1.94 | 1.38 | 1.21 | 0.57 | 0.32 |
Read the given extract carefully and transfer the following into a flow chart:
Garbage disposal has become a great problem in urban areas. A lot of garbage is being collected from every household. Some cities have come up with innovative ideas to tackle this problem. First of all, the garbage in trucks is segregated into organic waste from recyclable waste. Then it is put in separate containers.
Earthworm culture is added to this organic waste. After a few weeks the conversion process is complete and what we can get is vermicompost which is a very good quality compost that can be mixed with soil and used for better yields.
Non-verbal to Verbal:
Transfer the information into a paragraph:
Observe the tree diagram of types of disease and write a paragraph on it. Suggest a suitable title.

Read the following information and complete the table given below. Give a suitable title:
|
Turtles and tortoises are closely related. They are both reptiles from the same family (Testudines or Chelonian). The main difference between the two is that turtle is the name given to water-dwellers and tortoise is the name given to land-dwellers. They are easily identified by the presence of a shell, from which their head and limbs protrude. Turtles are found in Africa and America. Its shell is lighter and more streamlined than that of a tortoise. To enable swimming, it has webbed feet with long claws. Turtles are omnivores, eating both vegetation and meat. Their lifespan is shorter than that of the tortoise with an average of 20-40 years and a maximum of 86 years. Tortoises are found mainly in Asia and Africa, but also in America. It has a rounder, bumpier, heavier shell than a turtle. Its bent legs are short and sturdy. Tortoises are usually herbivores, but some eat meat, their lifespan is longer than that of the turtle with an average of 80-150 years and a maximum of 188 years. |
| FEATURES | TURTLES | TORTOISE |
| (i) Habitat | ||
| (ii) Places found in | ||
| (iii) Shell | ||
| (iv) Lifespan |
Verbal to Non-Verbal
Read the information in the given paragraphs and complete the table:
| Man and forest live in a close relationship. The forest fulfils most of man's needs. He collects resin, cane, timber, food and fruits from forests. The fallen branch gives him firewood. Trees purify the polluted air. But men have been unkind towards the forest for a few years. People must be made aware of the value of forests. Planting campaigns should be launched. The government of the world should enforce severe laws against wrongdoers. Vast areas of forest lands should be declared nature reserves. Scientists and engineers should be encouraged to find substitutes for wood like bamboo, hemp, etc. |
| ITEM | INFORMATION |
| Products of forest | |
| Firewood comes from | |
| Forests should be declared | |
| Substitutes for wood |
Given below is a web diagram containing information about the different means of electronic devices of entertainment-some audio, some visual and some audio-visual.
Write a short paragraph based on information from the web. Give a suitable title to it.

