Advertisements
Advertisements
प्रश्न
Non-verbal to Verbal
Study the table given below and prepare a paragraph on it.
| Alligators | Crocodiles | |
| 1. | U shaped round snout | V shaped round snout |
| 2. | Live in fresh water | Live in fresh water and saline water |
| 3. | Have wide jaws; upper jaw is wider than the lower jaw | Have narrow jaws; both the jaws are of the same size |
| 4. | Only upper teeth are visible when the mouth is closed | Both the teeth are visible when the mouth is closed. |
| 5. | No functioning salt glands | Very functional salt glands |
| 6. | Sensory pits on scales near the jaw | Sensory pits in every scale of the body |
Advertisements
उत्तर
Alligators v/s Crocodiles
The given table provides the distinguishing features between alligators and Crocodiles. While alligators have a U-shaped round snout, Crocodiles are found to have a V-shaped snout. The next difference is based on the habitat of these reptiles. While alligators are found only in fresh water, Crocodiles live in both fresh and saline waters. Alligators have wide jaws, wherein the upper jaw is wider than the lower jaw. As a result, only the teeth in the upper jaw are visible, when its mouth is closed. In Crocodiles however, both the jaws are relatively narrow and of the same size. Hence, both the teeth are visible when the mouth is closed. While Crocodiles have salt glands that are functional, alligators lack salt glands. The final difference between the two is based on the presence and location of sensory pits. In case of alligators, sensory pits are found on scales only near the jaw, whereas, in Crocodiles, these are found in every scale of its body.
APPEARS IN
संबंधित प्रश्न
Study carefully the following pie-chart about the Income Sources of a City Budget and write a short continuing paragraph based on it in about 120 words :

Read the following extract and extend it by adding an imaginary paragraph of your own in about 120 words:
[You may begin with: Mrs. Green: May I come in.......]
"May I come in?" asked the pink lady.
"Please come in," said my mother. "Do sit down. Do you require a room'?"
"Not today, thank you. I'm staying with Padre Dutt.
He insisted on putting me up. But I may want room for a day or two -- lust for old time's sake."
"You've stayed here before."
''A long time ago. I'm Mrs. Green, you know. The missing
Mrs. Green. The one for whom you put up that handsome tombstone in the cemetery. I was very touched by it. And I'm glad you didn't add 'Beloved wife of Henry Green' because I didn't' love him any more than he loved me.''
''Then - then - you aren't the skeleton?'' stammered my
mother.
''Do I look like a skeleton?''
''No!'' we said together.
· ''But we heard you disappeared,'' I said, ''and when we found that skeleton -''
''You put two and two together.''
''Well, it was Miss Kellner who convinced us,'' said my
mother. ''And you did disappear mysteriously. You were missing for years. And everyone knew Mr. Green was a philanderer!''
''Couldn't wait to get away from him," said the pink lady.
'Couldn't stand him anymore. He was a lady-killer, but not a real killer.''
''But your father ca1ne looking for you. Didn't you get in touch with him?''
The chart below shows information on the economics of the Annual
Sports Meet. Study the chart carefully.
| The Economics of the Annual Sports Meet |

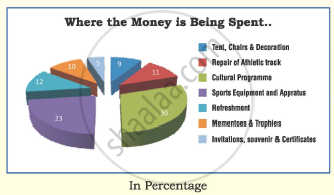
The total cost estimated of the Meet will be~ 11, 00, 000/-
No of athletes : 1250 (750 Girls+ 500 Boys; Category wise: sub-junior: 350, junior: 500 and senior: 400)
Staff on Duty : Teachers: 95 (35 men + 60 women), Support Staff 40 (21 men + 19 women), Staff on Parking and Security duty : 25 (20 men+ 5 women)
No of events : 100 ( 70 Track & Field events and 30 Jumps and Throws)
Medals : 100 Gold, 100Silver& 100Bronze
Best Athlete Trophies : Boys: 3, Girls: 3
Best House Trophies : 4( 1 for each category and 1 over all)
Suppose you are the Prin cipal of the school. Taking information from the chart, prepare an oral presentation for the Management Committee of the school. Use as many expressions of comparison as you can. You have been given some examples.
Read the following passage and complete the table
Dialect is a form of a language spoken in one area which may be different from other forms of the same language. Each language has dialects which change every few kilometers. India is a multi-lingual country. Each state follows its own language as official language. For example, Marathi is the official language of Maharashtra, while Ahirani, Wharadi, Konkani and Malwani are its dialects. Several languages in India are spoken but do not have any script. In Karnataka, Kannada is the official language. Tulu is spoken in Karnataka but has no script. In England, English is the official language while Scottish, spoken in Scotland and Welsh spoken in Wales are dialects of English.
| State | Official language | Dialects | Spoken/ Without script |
| Maharashtra | Marathi | ||
| Karnataka | |||
| England |
Views :
Develop a paragraph on the view by using the points given below :
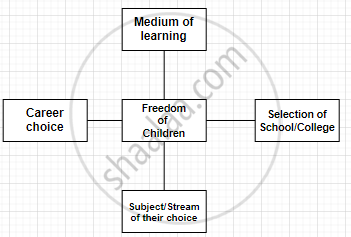
(i) Read the following tree diagram and find out more information about opportunities in ‘on and off the shore’ the Indian Navy.

(ii) Required qualifications and various fields/opportunities for women to join in the Navy.

(iii) Colleges that provide education in oceanography -
- National Institute of Oceanography, Goa
- National Institute of Oceanography, Mumbai
- MBA (Logistic Shipping Management), IIKM Business School, Calicut, Kerala
- Indira Gandhi College of Distance Education IGCDE Tamil Nadu.
Non-verbal to Verbal:
Transfer the information into a paragraph:
Observe the tree diagram of types of disease and write a paragraph on it. Suggest a suitable title.

Read the following information and complete the table given below. Give a suitable title:
|
Turtles and tortoises are closely related. They are both reptiles from the same family (Testudines or Chelonian). The main difference between the two is that turtle is the name given to water-dwellers and tortoise is the name given to land-dwellers. They are easily identified by the presence of a shell, from which their head and limbs protrude. Turtles are found in Africa and America. Its shell is lighter and more streamlined than that of a tortoise. To enable swimming, it has webbed feet with long claws. Turtles are omnivores, eating both vegetation and meat. Their lifespan is shorter than that of the tortoise with an average of 20-40 years and a maximum of 86 years. Tortoises are found mainly in Asia and Africa, but also in America. It has a rounder, bumpier, heavier shell than a turtle. Its bent legs are short and sturdy. Tortoises are usually herbivores, but some eat meat, their lifespan is longer than that of the turtle with an average of 80-150 years and a maximum of 188 years. |
| FEATURES | TURTLES | TORTOISE |
| (i) Habitat | ||
| (ii) Places found in | ||
| (iii) Shell | ||
| (iv) Lifespan |
Non-verbal to verbal
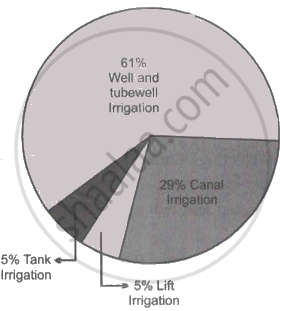
Read the information from the given bar graph and write it in paragraph form.
(A1) Verbal to Non-Verbal:
Read the following information and complete the flowchart for the same, and give a suitable title.
|
Sugar beet grows through the summer and is harvested in autumn and winter. When it arrives on site, the sugar beet is washed. The sugar beet is sliced into thin strips called cossettes.‘These thin strips are mixed with hot water to extract the sugar and a lime solution is added to the raw juice to remove any impurities. |
