Advertisements
Advertisements
प्रश्न
Diagram is given below shows velocity – time graph of car P and Q, starting from the same place and in the same direction. Calculate the Acceleration of car Q between 2 s – 5 s.

Advertisements
उत्तर

Acceleration of car Q between 2 s − 5 s = +Slope of v-t graph (CD) for car Q
= `"DE"/"CE"=25/(5-2)=25/3` = 8.33 ms−2
APPEARS IN
संबंधित प्रश्न
Define acceleration. State its unit.
Give one example of the following motion:
Uniform retardation
A train starts from rest and accelerates uniformly at a rate of 2 m s−2 for 10 s. It then maintains a constant speed for 200 s. The brakes are then applied and the train is uniformly retarded and comes to rest in 50 s. Find
- The maximum velocity reached,
- The retardation in the last 50 s,
- The total distance travelled,
- The average velocity of the train.
A racing car is moving with a velocity of 50 m/s. On
applying brakes, it is uniformly retarded and comes to rest in 20 seconds. Calculate its acceleration.
A car traveling at 60 km/h, stops on applying brakes in 10 seconds. What is its acceleration?
Write the SI unit of acceleration and retardation.
A car accelerates uniformly from a velocity of 18 km/h to 36 km/h in 15 min. What is its acceleration?
A car is moving with a speed of 50 km/h. One second later, its speed is 55 km/h. What is its acceleration?
A car accelerates to a velocity of 30 m/s in 10 s and then decelerates for 20 s so that it stops. Draw a velocity-time graph to represent the motion and find:
The Deceleration.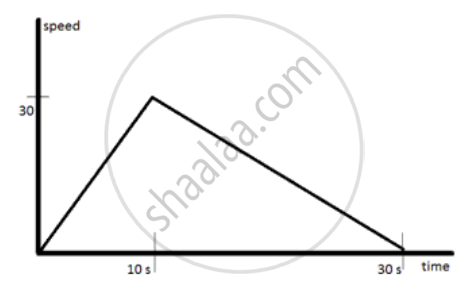
Acceleration is a scalar.
