Advertisements
Advertisements
प्रश्न
- Draw a V-I graph for a conductor obeying Ohm’s law.
- What does the slope of V–I graph for a conductor represent?
Advertisements
उत्तर

-
Use the Y-axis to plot V against I, and the X-axis to plot I. As can be seen in the illustration, the graphs are determined to be straight lines. So, the ohm law is confirmed.
APPEARS IN
संबंधित प्रश्न
Is Ohm’s law universally applicable for all conducting elements? If not, give examples of elements which do not obey Ohm’s law.
The relationship between the potential difference and the current in a conductor is stated in the form of a law.
1) Name the law.
2) What does the slope of V-I graph for a conductor represent?
3) Name the material used for making the connecting wire.
Ohm's law gives a relationship between:
(a) current and resistance
(b) resistance and potential difference
(c) potential difference and electric charge
(d) current and potential difference
Four resistances of 16 ohms each are connected in parallel. Four such combinations are connected in series. What is the total resistance?
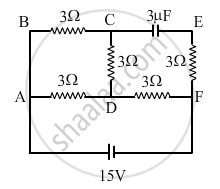
In the circuit shown in the figure, find the total resistance of the circuit and the current in the arm AD.
The resistance of a nichrome wire at 0°C is 10Ω. If its temperature coefficient of resistivity of nichrome is 0.004/ °C, find its resistance of the wire at boiling point of water. Comment on the result.
Which of the following is correct for V-I graph of a good conductor?
The temperature of a conductor is increased. The graph best showing the variation of its resistance is:
Two cells of same emf E but internal resistance r1 and r2 are connected in series to an external resistor R (Figure). What should be the value of R so that the potential difference across the terminals of the first cell becomes zero.
How is electric current related to the potential difference across the terminals of a conductor?
Draw a labelled circuit diagram to verify this relationship.
