Topics
Microeconomic Theory
Demand
- Introduction to Microeconomics and Macroeconomics
- Microeconomics
- Macroeconomics
- Macroeconomics Vs Microeconomics
- Introduction to Demand
- Meaning of Demand
- Features of Demand
- Types of Demand
- Determinants of Demand
- Demand Function
- Quantity Demanded and Demand
- Law of Demand
- Demand Schedule
- Demand Curve
- Individual Demand Curve to Market Demand Curve
- Slope of the Demand Curve
- Linear Demand Curve
- Reasons for the Downward Slope of the Demand Curve
- Importance of the Law of Demand
- Exceptions to the Law of Demand
- Movement Along the Demand Curve
- Change in Demand – Shift in Demand Curve
- Difference Between Extension and Increase in Demand
- Difference Between Contraction and Decrease in Demand
- Cross Price Effects
- Relationship Between Income and Demand
- Impact of Tastes and Preferences on Demand for a Commodity
- Industry Demand Vs Firm Demand
- Concept of Utility
- Cardinal Utility Analysis / Marginal Utility Analysis
- Types of Marginal Utility
- Total Utility and Marginal Utility
- Forms of Utility
- Features of Utility
- Relationship Between Total Utility and Marginal Utility
- Law of Diminishing Marginal Utility
- Exceptions of the Law of Diminishing Marginal Utility
- Importance of the Law of Diminishing Marginal Utility
- Consumer's Equilibrium through Cardinal Utility Approach
- Law of Equi-Marginal Utility
- Exceptions of the Law of Equi-marginal Utility
- Importance of the Law of Equi-marginal Utility
- Ordinal Utility Analysis/Indifference Curve Analysis
- Indifference Schedule
- Indifference Curve
- Indifference Map
- Marginal Rate of Substitution (MRS)
- Assumptions of Indifference Curve Analysis
- Properties of Indifference Curves
- Price Line or Budget Line
- Consumer's Equilibrium through Indifference Curve Approach
- Comparison of Utility Theory and Indifference Curve Theory
- Consumer's Equilibrium through Indifference Curve Approach
- Relationship Between Marginal Rate of Substitution and Marginal Utility
Theory of Income and Employment
- Introduction to Theory of Income and Employment
- Basic Model of Income Determination
- Aggregate Demand and Its Components
- Desired (Ex Ante) and Effective Demand (Ex Post)
- Propensity to Consume or Consumption Function
- Propensity to Save - Saving Function
- Relationship Between Consumption and Saving Functions
- Derivation of Saving Function
- Investment Expenditure
- Private and Public Investment
- Induced and Autonomous Investment
- Determination of Equilibrium Income and Output
- Concept of Aggregate Demand and Aggregate Supply
- Saving-investment Approach
- Investment Multiplier
- Investment Multiplier Defined
- The Multiplier Mechanism
- Graphic Presentation of Multiplier
- Derivation of Multiplier Formula
- Solved Numerical Problems on Propensity to Consume and Save, Equilibrium Income and Multiplier
- Meaning of Full Employment and Voluntary Unemployment
- The Concept of Full Employment
- Voluntary and Involuntary Unemployment
- Excess Demand
- Measures to Correct the Excess Demand
- Deficient Demand
- Measures to Correct Deficient Demand
- Deficient and Excess Demand and Business Cycle
- Aggregate Demand in a Three - Sector Economy
- Features of the Consumption Function
- Shifting of the Consumption Function
- Importance of the Consumption Function
- Gross Investment and Net Investment
- Paradox of Thrift
- Variables
- Partial and General Equilibrium
- Static Analysis
- Comparative Static Analysis
- Dynamic Analysis
- Difference between Static and Dynamic Analysis
- Psychological Law of Propensity to Consume
- Measures to Raise Propensity to Consume
- Importance of Investment
- Static Multiplier
- Dynamic Concept of Multiplier
- Limitations of Multiplier
- Leakages of Multipler
- Importance of Multiplier
- Types of Multiplier
- Balanced-Budget Multiplier
- Unemployment Associated with Full Employment
- Inflationary Gap
- Foreign Trade Policy
Elasticity of Demand
- Introduction to Elasticity of Demand
- Meaning and Types of Elasticity of Demand
- Price Elasticity of Demand
- Classification of Price Elasticity - Degrees of Price Elasticity of Demand
- Methods of Measuring Price Elasticity of Demand
- Percentage or Proportionate Method
- Total Expenditure Method
- Point Method (Geometric Method)
- Arc Elasticity of Demand
- Revenue Method
- Numerical Problems of Price Elasticity of Demand
- Factors Affecting Price Elasticity of Demand
- Importance of Elasticity of Demand
- Income Elasticity of Demand
- Types of Income Elasticity of Demand
- Importance of Income Elasticity
- Cross Elasticity of Demand
- Туpes of Cross Elasticity of Demand
- Limitations of Cross Elasticity of Demand
- Importance of Cross Elasticity of Demand
Money and Banking
- Introduction to Money and Inflation
- Concept of Money
- Features of Money
- Barter system
- Difficulties of Barter System of Exchange
- Evolution of Money
- Qualities of Good Money
- Modern Forms of Money
- Functions of Money
- Primary Functions
- Secondary Functions
- Contingent Functions
- Importance of Money
- Supply of Money
- Measures of Money Supply
- Inflation
- Types of Inflation
- Introduction to Banking System
- Types of Bank
- Functions of Commercial Bank
- Central Bank
- Functions of Central Bank
- Methods of Credit Control by the Central Bank
- Quantitative Methods of Credit Control by the Central Bank
- Qualitative Methods of Credit Control by the Central Bank
- Difference Between the Central Bank and the Commercial Banks
- Role of Banks in the Economy
- Indian Monetary System
- Constitutents of Money Supply
- Reserve Bank of India's Approach of Money Supply
- Factors Affecting Money Supply
- Commercial Banks
- Process of Credit Creation by Commercial Banking System
- Factors Affecting Credit Creation
- High Powered Money
- Classification or Structure of Commercial Banks in India
- Components of Money Supply
- Evolution of Central Bank
- Need for a Central Bank
- Importance of Central Bank
Supply
- Concept of Supply
- Individual and Market Supply
- Distinction Between Supply and Stock
- Determinants of Supply
- Supply Function
- Law of Supply
- Supply Schedule
- Supply Curve
- Derivation of Market Supply Curve From Individual Supply Curves
- Explanation of the Law of Supply
- Time Period and Supply
- Exceptions to the Law of Supply
- Movement Along the Supply Curve Or Expansion and Contraction of Supply
- Shift of the Supply Curve or Change in Supply
- Expansion of Supply and Increase in Supply
- Contraction of Supply and Decrease in Supply
- Elasticity of Supply
- Meaning and Types of Elasticity of Demand
- Price Elasticity of Supply
- Categories (Degrees) of Elasticity of Supply
- Measurement of Elasticity of Supply > Percentage Method
- Measurement of Elasticity of Supply > Geometric or Point Method
- Determinants of Elasticity of Supply
- Importance of Elasticity of Supply
Balance of Payments and Exchange Rate
- Concept of Balance of Payments
- International Linkages
- Open Economy and Its Linkages
- Balance Payment
- Definitions of Balance Payments
- Meaning of Balance of Payments
- Balance of Trade
- Balance of Invisible Trade
- Components of Balance of Payments
- Current Account
- Capital Account
- Categories of Balance of Payments
- Balance of Trade vs Current Account Balance
- Structure of Balance of Payments
- Methods to Measure Balance of Payments
- Capital Account Balance
- Balance of Payments Surplus and Deficit
- Autonomous and Accommodating Items
- Balance of Payments Disequilibrium
- Terms of Trade - Errors and Omissions Excepted (E&OE)
- Causes Behind Unfavourable Bop
- Remedies for Unfavourable Bop
- Monetary and Fiscal Policies to Correct Disequilibrium in the BOP Account
- Fiscal policies
- Foreign Exchange Rate
- Foreign Exchange
- Exchange Rate System
- Demand for Foreign Exchange
- Supply of Foreign Exchange
- Determination of Equilibrium Exchange Rate
- Shifts of the Demand Curve
- Shifts of the Supply Curve
- Advantages of Fixed Exchange Rate
- Disadvantages of Fixed Exchange Rate
- Advantages of Flexible Exchange Rate
- Disadvantages of Flexible Exchange Rate
- Types of Exchange Rate
- Factors Responsible for Exchange Rate Fluctuation
- Some Related Concepts of Exchange Rate
- Difference Between Devaluation and Depreciation
Market Mechanism
- Introduction to Market Mechanism
- Basic Concepts of Equilibrium and Equilibrium Price
- Equilibrium Price and Quantity in a Competitive Market
- Changes in Equilibrium
- Effects of Changes (Shifts) in Demand on Equilibrium Price and Equilibrium Quantity
- Effects of Changes (Shifts) in Supply on Equilibrium Price and Equilibrium Quantity
- Effects of Simultaneous Changes (Shifts) in Demand and Supply
- Some Special Cases of Equilibrium
- Importance of the Element in the Determination of Price
- Applications of Tools of Demand and Supply Price Control
- Mаximum Price Legislation or Price Ceiling and Rationing
- Minimum Price Legislation or Floor Price
- Important Areas of Applications of Tools of Demand and Supply Curves
- Meaning of Perfect Competition
- Assumptions and Conditions of Perfect Competition
- Pure and Perfect Competition
- Time Element in the Theory of Price Determination
- Determination of Equilibrium Prices
- Normal Price and Law of Returns
- Comparison between Market Price and Normal Price
- Practical Applications of Tools of Demand and Supply Analysis
Public Finance
- Introduction to Public Finance
- Public Revenue
- Nature and Significance of Taxes
- Tax and Fee
- Canons of Taxation
- Types of Taxes
- Merits of Direct Taxes
- Demerits of Direct Taxes
- Merits of Indirect Taxes
- Demerits of Indirect Taxes
- Direct Taxes vs Indirect Taxes
- Kinds of Tax System > Proportional tax
- Kinds of Tax System > Progressive Tax
- Kinds of Tax System > Regressive Tax
- Kinds of Tax System > Degressive Tax
- Kinds of Tax System > Digressive Tax
- Sources of Central Government Revenue
- Sources of State Government Revenues
- Value-Added Tax (VAT)
- Modified Value-Added Tax (MODVAT)
- MODVAT to CENVAT
- Public Expenditure
- Reasons for the Growth of Public Expenditures in India for Recent Times
- Importance of Public Expenditure in a Developing Country
- Public Debt
- Structure (Types) of Public Debt
- Reasons Behind Internal Public Debt
- Reasons Behind External Public Debt
- Methods of Redemption of Public Debt
- The Burden of Public Debt
- Main Sources of Internal & External Debt of the Government of India
- Distinction Between Internal Debt and External Debt
- Effects of Government Borrowings on the Indian Economy
- Fiscal Policy
- Objectives of Fiscal Policy
- Role of Fiscal Policy
- Instruments of Fiscal Policy
- Fiscal Measures for Stabilisation
- Effective Role of Fiscal Policy for Underdeveloped or Developing Country
- Limitations of Fiscal Policy
- Role of Fiscal Policy to Control Inflationary Situation
- Deficit Financing
- Reason for Deficit Financing
- Effects of Deficit Financing
- Limits of Deficit Financing
- Introduction to Budget
- Government Budget
- Need and Importance of Government Budget
- Objectives of Government Budget
- Types of Government Budget in India
- Modern Classification of Budget
- Balanced and Unbalanced Budget
- Unbalanced/Deficit - Surplus Budget
- Zero-Base Budgeting (ZBB)
- Zero-Base Budgeting in India
- Components (Structure) of the Government Budget
- Budget Receipts
- Revenue Receipts
- Tax Receipts
- Non-Tax Receipts
- Capital Receipts
- Budget Expenditure
- Revenue Expenditure and Capital Expenditure
- Plan Expenditure and Non-plan Expenditure
- Budget Deficits
- Budgetary Procedure
- Developmental and Non-developmental Expenditures
- Balanced Budget vs Deficit or Surplud Budget
Concepts of Production
- Concept of Production
- Product
- Factors of Production
- Production Function
- Short-run and Long-run
- Features of Production Function
- Types of Production Functions
- Some Basic Concepts - Total, Average and Marginal Physical Products
- Relationship between Average Product (AP) and Marginal Product (MP)
- Relationship between Total Product (TP) and Marginal Product (MP)
- Returns to a Factor - Laws of Returns to a Variable Factor
- Law of Variable Proportions
- Statement of the Law of Variable Proportions
- Assumptions of the Law of Variable Proportions
- Illustration of the Law of Variable Proportions
- Three Stages of Production
- Explanation of the Law of Variable Proportions
- Stages of Operation and the Decision to Produce
- Conditions Or Causes of Applicability
- Applicability of the Law of Variable Proportions
- Changes in Production
- Returns to a Factor or Law of Returns
- Law of Variable Proportions and Returns to Scale Compared
- Variation of Output in the Long Run - Returns to Scale
- Scale of Production
- Concept of Indivisibility
- Economies of Scale
- Diseconomies of Scale
Cost and Revenue
- Introduction to Cost of Production
- Money Cost Or Accounting Cost / Explicit Cost
- Economic Cost
- Opportunity Cost
- Real Cost
- Private and Social Cost
- Fixed Cost and Variable Cost
- Different Cost Concepts
- Total Cost Curves
- Average Cost Curves
- Marginal Cost (MC)
- Relationship between Average and Marginal Cost
- Long-Run Cost Curves
- Long-run Average Cost (LAC) Curve
- Long-run Marginal Cost (LMC) Curve
- LAC Curve U-shaped - Economies and Diseconomies of Scale
- Numerical Problems Long-run Cost Curves
- Revenue Concepts
- Behaviour of Revenue Under Different Market Structures
- Relationship Between Total, Average and Marginal Revenues Under Perfect Competition
- Relationship Between Total, Average and Marginal Revenue Under Imperfect Competition
- Significance of Revenue Curve
- Numerical Problems of Revenue
National Income
- Concept of National Income
- Вasic Concept about Domestic Territory
- Basic Concepts Related to Domestic Income and National Income
- Net Factor Income from Abroad (NFIA)
- Significance or Importance of National Income
- Circular Flow of Income
- Circular Flow of Income in a Two-Sector Economy
- Circular Flow of Income in a Two-Sector Economy with Savings and Investment
- Circular Flow of Income in a Three-Sector Economy
- Circular Flow of Income in a Four-Sector Economy
- Circular Flow in Open Economy
- Significance of Circular Flow of Income
- Equilibrium of the Flow of National Income Or Injections and Withdrawals
- Nature of Goods and Services
- Economic Goods and Non-Economic Goods
- Material and Non-Material Goods
- Consumer and Producer Goods
- Single-Use (Non-Durable) Goods and Durable Goods
- Intermediate Goods and Final Goods
- Important Concepts of National Income
- Gross Domestic Product
- Gross National Product
- Net Domestic Product
- Net National Product (NNP)
- National Disposable Income
- Net National Income or Product at Factor Cost
- Net Domestic Product or Income at Factor Cost
- Gross Domestic Product or Income at Factor Cost
- Gross National Product at Factor Cost
- Income from Domestic Product Accruing to Private Sector
- Private Income
- Microeconomics > Personal Income
- Basic Concepts of Microeconomics > Personal Disposable Income
- Relationship Between Arious National Income Aggregates
- Per Capita Income
- Real Income
- GDP and Welfare
- Circular Flow of Production, Income and Expenditure
- Methods of Measurement of National Income
- Income Method
- Classification of Factor Income
- Estimation of Factor Income
- Main Precautions in Income Method
- Output Method/Product Method
- Net Product or Value Added Method
- Main Precautions in Product Method
- Expenditure Method
- Measurement of Final Expenditure
- Estimation of National Income
- Main Precautions in Expenditure Method
- Summary of the Three Methods for Measurement of GDP
- Treatment of Items in the Estimation of GNP
- GNP and Economic Welfare
- Difficulties of Measuring National Income in a Less-Developed Economy
- Methods of Measurement of National Income
- Transactions Included in National Income
- Transactions not Included in National Income
Main Market Forms and Equilibrium of a Firm
- Concept of Market
- Market Structure
- Factors Determining Market Forms
- Perfect Competition
- Features of Perfect Competition
- Pure and Perfect Competition
- Monopoly
- Features of Monopoly
- Monopolistic Competition
- Features of Monopolistic Competition
- Oligopoly
- Features of Oligopoly
- Monopsony
- Features of Monopsony
- Duopoly
- Characteristics of Duopoly
- Bilateral Monopoly
- Other Forms of Market
- Factors Determining Market / Extent of Market
- Demand Curves of Firms under Different Market Forms
- Comparison between different forms of market
- Difference Between Imperfect Competition and Monopolistic Competition
- Firm : An Economic Entity
- Profit Maximisation Objective
- The Definition of Profits
- Rules for Profit-Maximisation
- Producer's (Firm's) Equilibrium: Total Revenue and Total Cost Approach
- Producer's (Firm's) Equilibrium: Marginal Revenue and Marginal Cost Approach
- Short-run Equilibrium
- Long-run Equilibrium
- Firm is a Price Taker, Not a Price Maker
- Equilibrium of Industry
- Difference Between Firm and Industry's Equilibrium
- Meaning of a Producer
- Producer's Equilibrium under Perfect Competition
- Determination of Price and Equilibrium Under Monopoly
- Monopoly Equilibrium and Laws of Costs
- Price Discrimination or Discriminating Monopoly
- Price and Output Discrimination Under Discriminating Monopoly
- Measures of Monopoly Power
- Nature of Demand and Cost Curves
- Equilibrium Price and Output under Monopolistic Competition
- Group Equilibrium in Monopolistic Competition
- Product Differentiation
- Selling Costs
- Equilibrium with Selling Costs
- Price and Output Under Oligopoly Indeterminate
- Price and Output Determination under Oligopoly
- Price Rigidity-Sweezy's Kinky Demand Curve Model or Equilibrium under Independent Action
- Reasons for Price Stability
- Cournot's Model
- Collusive Oligopoly
- Mergers
CISCE: Class 12
Meaning
- Market equilibrium price and quantity are not fixed forever.
- They change when the demand curve or the supply curve (or both) shifts due to changes in underlying conditions.
CISCE: Class 12
Effect of shift in demand
Causes of shift in demand
- Demand increases when income rises (for normal goods), tastes improve, price of substitute rises, price of complement falls, etc.
- Demand decreases when income falls (for normal goods), tastes worsen, price of substitute falls, price of complement rises, etc.
Direction of shift
- Increase in demand ⇒ demand curve shifts to the right (upward).
- Decrease in demand ⇒ demand curve shifts to the left (downward).
Graph explanation
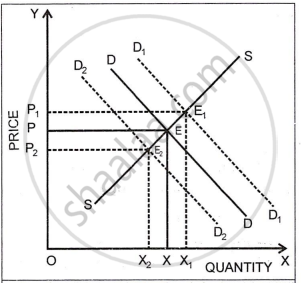
- On the X-axis: quantity; on the Y-axis: price.
- DD is the original demand curve and SS is the supply curve. They intersect at point E, giving equilibrium price OP and equilibrium quantity OX.
- When demand increases, the new demand curve is D₁D₁. It lies to the right of DD and cuts the same supply curve SS at a new point E₁.
i. The new equilibrium price rises from OP to OP₁.
ii. The new equilibrium quantity rises from OX to OX₁. - When demand decreases, the demand curve shifts to D₂D₂ (left of DD) and intersects SS at E₂.
i. The new equilibrium price falls from OP to OP₂.
ii. The new equilibrium quantity falls from OX to OX₂.
Conclusion for demand shift
If supply remains unchanged, there is a direct relationship between demand and price:
Demand ↑ ⇒ Equilibrium price ↑ and equilibrium quantity ↑.
Demand ↓ ⇒ Equilibrium price ↓ and equilibrium quantity ↓.
CISCE: Class 12
Effect of shift in supply
Causes of shift in supply
- Supply increases when input costs fall, technology improves, there is favourable weather for agricultural goods, indirect taxes are lower, etc.
- Supply decreases when input costs rise, poor technology, bad weather, higher taxes, etc.
Direction of shift
- Increase in supply ⇒ supply curve shifts to the right (downward).
- Decrease in supply ⇒ supply curve shifts to the left (upward).
Graph explanation
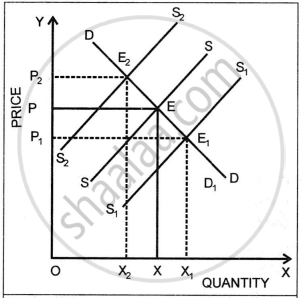
- Demand curve DD and supply curve SS initially intersect at point E. Equilibrium price is OP, and equilibrium quantity is OX.
- When supply increases, the supply curve shifts to S₁S₁ (right of SS). New equilibrium is at E₁.
i. Equilibrium quantity rises from OX to OX₁.
ii. Equilibrium price falls from OP to OP₁. - When supply decreases, the supply curve shifts to S₂S₂ (left of SS). New equilibrium is at E₂.
i. Equilibrium quantity falls from OX to OX₂.
ii. Equilibrium price rises from OP to OP₂.
Conclusion for supply shift
If demand remains unchanged, there is an inverse relationship between supply and price:
Supply ↑ ⇒ Equilibrium price ↓, equilibrium quantity ↑.
Supply ↓ ⇒ Equilibrium price ↑, equilibrium quantity ↓.
CISCE: Class 12
Real-Life Application
- Increase in demand:
During festivals, demand for sweets and clothes rises even if supply is the same. Shops often raise prices and still sell more units; both price and quantity sold increase. - Increase in supply:
After a bumper harvest of wheat, supply in the market increases. Even if people’s demand is the same, wheat prices usually fall and more wheat is sold overall.
CISCE: Class 12
Key Points: Changes in Equilibrium
- Equilibrium price and quantity change whenever demand or supply curves shift.
- A rightward shift of demand or supply shows an increase; a leftward shift shows a decrease.
- With supply fixed, demand and price move in the same direction (direct relation).
- With demand fixed, supply and price move in the opposite direction (inverse relation).
- Diagrams must show original curves (DD, SS), new curves (D₁D₁, D₂D₂, S₁S₁, S₂S₂), and old/new equilibrium points (E, E₁, E₂) with corresponding prices and quantities.
