Advertisements
Advertisements
प्रश्न
The graph shows the variation of photocurrent for a photosensitive metal
- What does X and A on the horizontal axis represent?
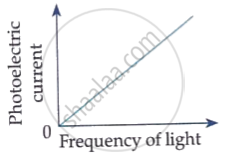
- Draw this graph for three different values of frequencies of incident radiation ʋ1, ʋ2 and ʋ3 (ʋ3 > ʋ2 > ʋ1) for the same intensity.
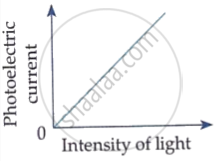
- Draw this graph for three different values of intensities of incident radiation I1, I2 and I3 (I3 > I2 > I1) having the same frequency.
Advertisements
उत्तर
a. A - cut off or stopping potential
X - anode potential
b. 
Variation of photoelectric current with collector plate potential for different frequencies of incident radiation.
c.
Variation of photocurrent with collector plate potential for different intensity of incident radiation.
APPEARS IN
संबंधित प्रश्न
The work function for the following metals is given:
Na: 2.75 eV; K: 2.30 eV; Mo: 4.17 eV; Ni: 5.15 eV
Which of these metals will not give photoelectric emission for a radiation of wavelength 3300 Å from a He-Cd laser placed 1 m away from the photocell? What happens if the laser is brought nearer and placed 50 cm away?
Let nr and nb be the number of photons emitted by a red bulb and a blue bulb, respectively, of equal power in a given time.
When stopping potential is applied in an experiment on photoelectric effect, no photoelectric is observed. This means that
In which of the following situations, the heavier of the two particles has smaller de Broglie wavelength? The two particles
(a) move with the same speed
(b) move with the same linear momentum
(c) move with the same kinetic energy
(d) have fallen through the same height
A sphere of radius 1.00 cm is placed in the path of a parallel beam of light of large aperture. The intensity of the light is 0.5 W cm−2. If the sphere completely absorbs the radiation falling on it, find the force exerted by the light beam on the sphere.
(Use h = 6.63 × 10⁻³⁴J-s = 4.14 × 10⁻¹⁵ eV-s, c = 3 × 10⁸ m/s and me = 9.1 × 10⁻³¹kg)
The work function of a metal is 2.5 × 10⁻¹⁹ J. (a) Find the threshold frequency for photoelectric emission. (b) If the metal is exposed to a light beam of frequency 6.0 × 10¹⁴ Hz, what will be the stopping potential?
(Use h = 6.63 × 10⁻³⁴J-s = 4.14 × 10⁻¹⁵ eV-s, c = 3 × 10⁸ m/s and me = 9.1 × 10⁻³¹kg)
Answer the following question.
Plot a graph of photocurrent versus anode potential for radiation of frequency ν and intensities I1 and I2 (I1 < I2).
Consider a 20 W bulb emitting light of wavelength 5000 Å and shining on a metal surface kept at a distance 2 m. Assume that the metal surface has work function of 2 eV and that each atom on the metal surface can be treated as a circular disk of radius 1.5 Å.
- Estimate no. of photons emitted by the bulb per second. [Assume no other losses]
- Will there be photoelectric emission?
- How much time would be required by the atomic disk to receive energy equal to work function (2 eV)?
- How many photons would atomic disk receive within time duration calculated in (iii) above?
- Can you explain how photoelectric effect was observed instantaneously?
If photons of ultraviolet light of energy 12 eV are incident on a metal surface of work function of 4 eV, then the stopping potential (in eV) will be :
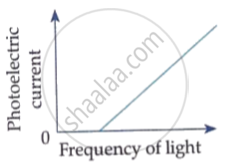
Which of the following options represents the variation of photoelectric current with property of light shown on the x-axis?