Advertisements
Advertisements
प्रश्न
Solve the inequality and represent the solution graphically on number line:
2(x – 1) < x + 5, 3(x + 2) > 2 – x
Advertisements
उत्तर
2(x – 1) < x + 5
⇒ 2x – 2 < x + 5
⇒ 2x – x < 5 + 2
⇒ x < 7 … (1)
3(x + 2) > 2 – x
⇒ 3x + 6 > 2 – x
⇒ 3x + x > 2 – 6
⇒ 4x > – 4
⇒ x > – 1 … (2)
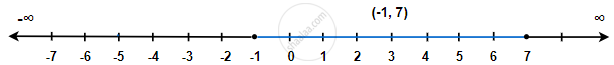
From (1) and (2), it can be concluded that the solution set for the given system of inequalities is (–1, 7). The solution of the given system of inequalities can be represented on number line as
APPEARS IN
संबंधित प्रश्न
Solve the given inequality graphically in two-dimensional plane: x + y < 5
Solve the given inequality graphically in two-dimensional plane: 2x + y ≥ 6
Solve the given inequality graphically in two-dimensional plane: 3x + 4y ≤ 12
Solve the given inequality graphically in two-dimensional plane: x – y ≤ 2
Solve the given inequality graphically in two-dimensional plane: –3x + 2y ≥ –6
Solve the given inequality graphically in two-dimensional plane: 3y – 5x < 30
Solve the given inequality graphically in two-dimensional plane: y < –2
Solve the given inequality graphically in two-dimensional plane: x > –3
A solution is to be kept between 68° F and 77° F. What is the range in temperature in degree Celsius (C) if the Celsius/Fahrenheit (F) conversion formula is given by `F= 9/8` C + 32?
A solution of 8% boric acid is to be diluted by adding a 2% boric acid solution to it. The resulting mixture is to be more than 4% but less than 6% boric acid. If we have 640 litres of the 8% solution, how many litres of the 2% solution will have to be added?
How many litres of water will have to be added to 1125 litres of the 45% solution of acid so that the resulting mixture will contain more than 25% but less than 30% acid content?
IQ of a person is given by the formula
IQ = `(MA)/(CA) xx100`
Where MA is mental age and CA is chronological age. If 80 ≤ IQ ≤ 140 for a group of 12 years old children, find the range of their mental age.
Solve the following systems of linear inequations graphically:
x + y ≥ 1, 7x + 9y ≤ 63, x ≤ 6, y ≤ 5, x ≥ 0, y ≥ 0
Show that the solution set of the following linear inequations is empty set:
x + 2y ≤ 3, 3x + 4y ≥ 12, y ≥ 1, x ≥ 0, y ≥ 0
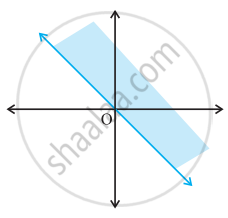
Find the linear inequations for which the solution set is the shaded region given in Fig. 15.42
Show that the solution set of the following linear in equations is an unbounded set:
x + y ≥ 9
3x + y ≥ 12
x ≥ 0, y ≥ 0
Solve the following systems of inequations graphically:
2x + y ≥ 8, x + 2y ≥ 8, x + y ≤ 6
Solve the following systems of inequations graphically:
12x + 12y ≤ 840, 3x + 6y ≤ 300, 8x + 4y ≤ 480, x ≥ 0, y ≥ 0
Solve the following systems of inequations graphically:
x + 2y ≤ 40, 3x + y ≥ 30, 4x + 3y ≥ 60, x ≥ 0, y ≥ 0
Solve the following systems of inequations graphically:
5x + y ≥ 10, 2x + 2y ≥ 12, x + 4y ≥ 12, x ≥ 0, y ≥ 0
Show that the following system of linear equations has no solution:
\[x + 2y \leq 3, 3x + 4y \geq 12, x \geq 0, y \geq 1\]
Show that the solution set of the following system of linear inequalities is an unbounded region:
\[2x + y \geq 8, x + 2y \geq 10, x \geq 0, y \geq 0\]
Find the linear inequalities for which the shaded region in the given figure is the solution set.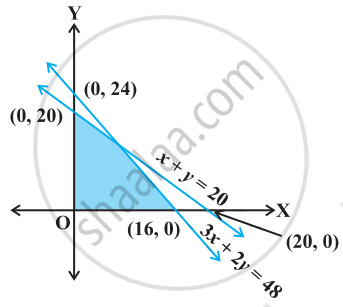
State which of the following statement is True or False.
If xy > 0, then x < 0 and y < 0
Graph of x ≥ 0 is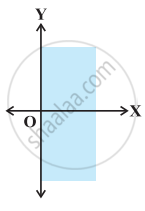
Graph of y ≤ 0 is
Solution set of x + y ≥ 0 is