Advertisements
Advertisements
प्रश्न
Observe the following graph and answer the questions given below:
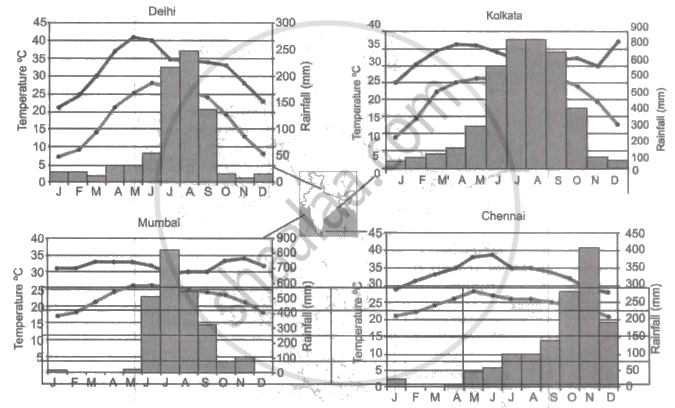
Note: In the graphs, the dark line represents the max. temperature and the lighter line represents min. temperature. The bars represent the amount of rainfall every month in each city.
- Where in the four cities is the rainfall heaviest?
- Which city has the most rainfall throughout the year?
- Which city experiences the highest temperature?
- Calculate the average range of minimum and maximum temperature for all four cities.
- What do the temperature curves in Delhi indicate?
- What is the condition of Mumbai during monsoons?
Advertisements
उत्तर
- Kolkata receives the heaviest rainfall among the four cities.
- Kolkata receives the most rainfall throughout the year.
- Delhi experiences the highest temperature.
- The minimum and maximum range of temperatures are:
(i) Delhi: Maximum - 20°C; Minimum - 22°C
(ii) Kolkata: Maximum - 12°C; Minimum - 18°C
(iii) Mumbai: Maximum - 3°C; Minimum - 9°C
(iv) Chennai: Maximum - 10°C; Minimum - 7°C - The temperature curves of Delhi show that the city experiences extreme temperatures.
- Mumbai receives heavy rainfall during the months of monsoon.
APPEARS IN
संबंधित प्रश्न
The average annual temperature in India is generally high.
Choose the right answer from the alternative given below.
Monsoon arrives in India approximately in
Explain the importance of the Himalayas and the Indian Ocean with respect to the climate of India.
Chennai enjoys ______ climate.
Palmyra is found in ______ forests.
Match the Column I with Column II.
| Column I | Column II | |
| A. | Equable climate | Climatic barrier |
| B. | Western Ghats | Windward side |
| C. | Peninsular region | British climate |
| D. | Manglore | Leeward side |
| E. | bengaluru | Maritime climate |
Match the Column I with Column II.
| Column I | Column II | |
| A. | Tropical evergreen forest | Sandal wood |
| B. | Tropical Deciduous forest | Oak, silver fir |
| C. | Alpine forest | Black buck |
| D. | Tidal forest | Casuarina |
| E. | Coastal forest | Mahogany |
| F. | State animal of Andhra Pradesh, Pujab and Haryana | Mangrove trees |
Since the northern plains are far away from the influence of the seas, they have ______.
State whether right or wrong.
Temperature decreases from north to south in India.
On an outline map of India, show the following.
- Areas receiving rainfall over 400 cm.
- Areas receiving less than 20 cm of rainfall.
- The direction of the south-west monsoon over India.
