Advertisements
Advertisements
प्रश्न
Observe the following graph and answer the questions given below:
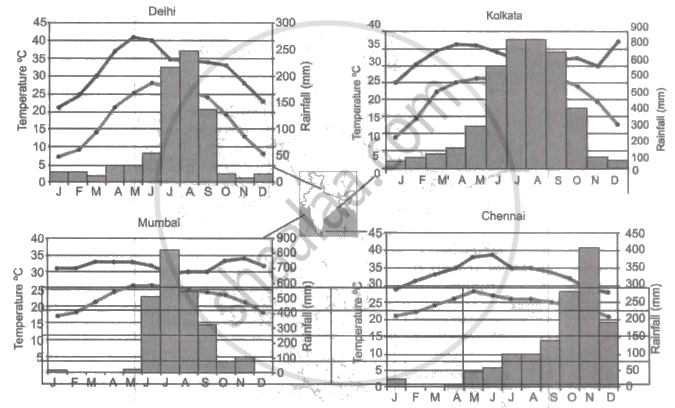
Note: In the graphs, the dark line represents the max. temperature and the lighter line represents min. temperature. The bars represent the amount of rainfall every month in each city.
- Where in the four cities is the rainfall heaviest?
- Which city has the most rainfall throughout the year?
- Which city experiences the highest temperature?
- Calculate the average range of minimum and maximum temperature for all four cities.
- What do the temperature curves in Delhi indicate?
- What is the condition of Mumbai during monsoons?
Advertisements
उत्तर
- Kolkata receives the heaviest rainfall among the four cities.
- Kolkata receives the most rainfall throughout the year.
- Delhi experiences the highest temperature.
- The minimum and maximum range of temperatures are:
(i) Delhi: Maximum - 20°C; Minimum - 22°C
(ii) Kolkata: Maximum - 12°C; Minimum - 18°C
(iii) Mumbai: Maximum - 3°C; Minimum - 9°C
(iv) Chennai: Maximum - 10°C; Minimum - 7°C - The temperature curves of Delhi show that the city experiences extreme temperatures.
- Mumbai receives heavy rainfall during the months of monsoon.
APPEARS IN
संबंधित प्रश्न
Give reason as to why.
Parts of Rajasthan, Gujarat and the leeward side of the Western Ghats are drought-prone.
Match the following
| 1. | Sundarbans | Desert and semi desert vegetation |
| 2. | Biodiversity hotspot | October - December |
| 3. | North east monsoon | Littoral forest |
| 4. | Tropical thorn forests | West Beangal |
| 5. | Coastal forests | The Himalayas |
Western Coastal plain is narrow.
The Predominant soil in the coastal plains and north Indian Plains is ______.
Match the following.
| 1. | Manas | Jammu & Kashmir |
| 2. | Madumalai | Jharkhand |
| 3. | Duchigam | Assam |
| 4. | Hazari Bagh | Rajasthan |
| 5. | Sarika | Tamil Nadu |
Match the Column I with Column II.
| Column I | Column II | |
| A. | Western Disturbance | Driest place on Earth |
| B. | Norwesters | North East monson |
| C. | Burst of monsoon | Bihar- Assam |
| D. | Cyclonic Depression | Marine Biosphere Reserve |
| E. | Gulf of mannar | South west monsoon |
| F. | Atacama desert | Punjab - Haryana |
Since the northern plains are far away from the influence of the seas, they have ______.
Equable climate is also called as the ______.
Answer in one word.
Which place has the lowest recorded temperature in India?
Which part of India experiences the highest range of temperature in a day?
