Advertisements
Advertisements
प्रश्न
| Stations | Latitude | Altitude (Metres) | Jan. | Feb. | Mar. | Apr. | May. | Jun. | July. | Aug. | Sep. | Oct. | Nov. | Dec. | Annual Rainfall |
|
Temperature (°C) |
20.5 |
22.7 |
25.2 |
27.1 |
26.7 |
24.2 |
23.0 |
23.0 |
23.1 |
22.9 |
18.9 |
20.2 |
|||
| Bengaluru | 12°58'N | 909 |
|
|
|
||||||||||
| Rainfall (cm) | 0.7 | 0.9 | 1.1 | 4.5 | 10.7 | 7.1 | 11.1 | 13.7 | 16.4 |
15.3 |
6.1 |
1.3 |
88.9 | ||
|
Temperature (°C) |
24.4 |
24.4 |
26.7 |
28.3 |
30.0 |
28.9 |
27.2 |
27.2 |
27.2 |
27.8 |
27.2 |
25.0 |
|||
|
Mumbai |
19° N | 11 |
|
|
|
|
|
|
|
|
|
|
|
|
|
|
Rainfall (cm) |
0.2 |
0.2 |
– |
– |
1.8 |
50.6 |
61.0 |
36.9 |
26.9 |
4.8 |
1.0 |
– |
183.4 | ||
|
Temperature (°C) |
19.6 |
22.0 |
27.1 |
30.1 |
30.4 |
29.9 |
28.9 |
28.7 |
28.9 |
27.6 |
23.4 |
19.7 |
|||
|
Kolkata |
22°34'N | 6 |
|
|
|
|
|
|
|
|
|
|
|
|
|
|
Rainfall (cm) |
1.2 |
2.8 |
3.4 |
5.1 |
13.4 |
29.0 |
33.1 |
33.4 |
25.3 |
12.7 |
2.7 |
0.4 |
162.5 | ||
|
Temperature (°C) |
14.4 |
16.7 |
23.3 |
30.0 |
33.3 |
33.3 |
30.0 |
29.4 |
28.9 |
25.6 |
19.4 |
15.6 |
|||
|
Delhi |
29° N | 219 |
|
|
|
|
|
|
|
|
|
|
|
|
|
|
Rainfall (cm) |
2.5 |
1.5 |
1.3 |
1.0 |
1.8 |
7.4 |
19.3 |
17.8 |
11.9 |
1.3 |
0.2 |
1.0 |
67.0 | ||
|
Temperature (°C) |
16.8 |
19.2 |
26.6 |
29.8 |
33.3 |
33.9 |
31.3 |
29.0 |
20.1 |
27.0 |
20.1 |
14.9 |
|||
|
Jodhpur |
26°18'N | 224 |
|
|
|
|
|
|
|
|
|
|
|
|
|
|
Rainfall (cm) |
0.5 |
0.6 |
0.3 |
0.3 |
1.0 |
3.1 |
10.8 |
13.1 |
5.7 |
5.7 |
0.2 |
0.2 |
36.6 | ||
|
Temperature (°C) |
24.5 |
25.7 |
27.7 |
30.4 |
33.0 |
32..5 |
31.0 |
30.2 |
29.8 |
28.0 |
25.9 |
24.9 |
|||
|
Chennai |
13°4'N | 7 |
|
|
|
|
|
|
|
|
|
|
|
|
|
|
Rainfall (cm) |
4.6 |
1.3 |
1.3 |
1.8 |
3.8 |
22.2 |
8.7 |
11.3 |
11.9 |
30.6 |
35.0 |
0.2 |
128.6 | ||
|
Temperature (°C) |
21.5 |
23.9 |
28.3 |
32.7 |
35.5 |
32.0 |
27.7 |
27.3 |
27.9 |
26.7 |
23.1 |
20.7 |
|||
|
Nagpur |
21°9'N | 312 |
|
|
|
|
|
|
|
|
|
|
|
|
|
|
Rainfall (cm) |
1.1 |
2.3 |
1.7 |
1.6 |
2.1 |
22.2 |
37.6 |
28.6 |
18.5 |
5.5 |
2.0 |
13.9 |
124.2 | ||
|
Temperature (°C) |
9.8 |
11.3 |
15.9 |
18.5 |
19.2 |
20.5 |
21.1 |
20.9 |
20.9 |
17.2 |
13.3 |
10.4 |
|||
|
Shillong |
24°34'N | 1461 |
|
|
|
|
|
|
|
|
|
|
|
|
|
|
Rainfall (cm) |
1.4 |
2.9 |
5.6 |
14.6 |
29.5 |
47.6 |
35.9 |
34.3 |
30.2 |
18.8 |
3.8 |
1.0 |
225.3 | ||
|
Temperature (°C) |
26.7 |
27.3 |
28.3 |
28.7 |
28.6 |
26.6 |
26.2 |
26.2 |
26.5 |
26.7 |
26.6 |
26.5 |
|||
|
Thiruvananthapuram |
8°29'N | 61 |
|
|
|
|
|
|
|
|
|
|
|
|
|
|
Rainfall (cm) |
2.3 |
2.1 |
3.7 |
10.6 |
20.8 |
35.6 |
22.3 |
14.6 |
13.8 |
27.3 |
20.6 |
7.5 |
181.2 | ||
|
Temperature (°C) |
−8.5 |
−7.2 |
−0.6 |
6.1 |
10.0 |
14.4 |
17.2 |
16.1 |
12.2 |
6.1 |
0.0 |
−5.6 |
|||
|
Leh |
34°N | 3506 |
|
|
|
|
|
|
|
|
|
|
|
|
|
|
Rainfall (cm) |
1.0 |
0.8 |
0.8 |
0.5 |
0.5 |
0.5 |
1.3 |
1.3 |
0.8 |
0.5 |
– |
0.5 |
8.5 |
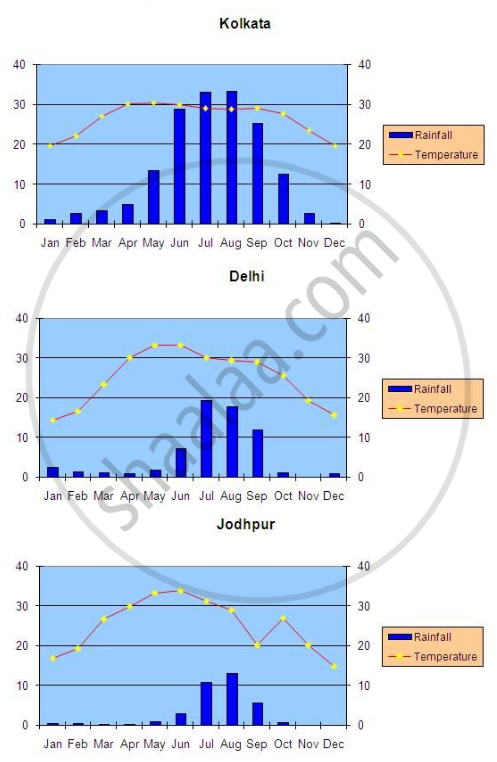
In above Table the average mean monthly temperatures and amounts of rainfall of ten representative stations have been given. It is for you to study on your own and convert them into ‘temperature and rainfall’ graphs. A glance at these visual representations will help you to grasp instantly the similarities and differences between them. One such graph (Figure 1) is already prepared for you. See if you can arrive at some broad generalisations about our diverse climatic conditions. 
Advertisements
उत्तर


APPEARS IN
संबंधित प्रश्न
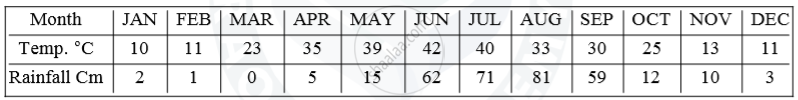
Study the climatic data given below and answer the questions that follow:
| Month | Jan | Feb | Mar | Apr | May | June | July | Aug | Sep | Oct | Nov | Dec |
| Temperature in °C |
12.0 | 25.5 | 26.3 | 27.1 | 30.0 | 36.2 | 36.0 | 35.9 | 30.3 | 28.4 | 21.0 | 16.6 |
| Rainfall cm | 1.5 | 0.1 | 0.0 | 1.4 | 1.1 | 21.0 | 25.3 | 27.2 | 24.0 | 9.4 | 1.5 | 0.4 |
1) What is the annual range of temperature of the station?
2) What is the total annual rainfall experienced by the station?
3) Why would it be correct to presume that the station lies in the interior and not on the coast?
Give reasons for the following:
When the Malabar Coast is receiving heavy rainfall in July, the Tamil Nadu coast is comparatively dry.
Study the data of distribution of temperature and rain for Station X and answer the questions that follow :
(i) Is Station X in the coastal area or in the interior of the country?
(ii) Calculate the total annual rainfall for Station X.
(iii) Name the wind that brings most of the rainfall to Station X.
What are ‘Western Disturbances’?
Why are there great variations in the climate of the Indian sub-continent?
Mention why does sub-continent have Tropical Monsoon climate.
Study the climatic data given below and answer the questions that follow:
| Month | Jan. | Feb. | Mar. | Apr. | May | Jun. | Jul. | Aug. | Sep. | Oct. | Nov. | Dec. |
| °C | 25.0 | 25.5 | 26.3 | 27.1 | 30.0 | 36.2 | 36.0 | 35.9 | 30.3 | 28.4 | 27.0 | 24.6 |
| cm | 24.5 | 23.1 | 15.0 | 2.4 | 0.1 | 11.0 | 9.3 | 7.2 | 4.0 | 9.4 | 14.5 | 20.4 |
(i) Calculate the annual temperature range.
(ii) What is the total annual rainfall?
(iii) Presuming that the station is located in India, give a reason for its location being on the east coast or the west coast of India.
Name the state of Indian Union where the rainy season is very short?
The average rainfall of India is about ______.
Seventy-five percentage of Indian rainfall is from this wind.
