Advertisements
Advertisements
Two ropes, one 8 meters long and the other 12 meters long are to be cut into pieces of the same length. What will the maximum possible length of each piece be?
Concept: undefined >> undefined
The number of students of Std 6th and Std 7th who went to visit the Tadoba Tiger Project at Chandrapur was 140 and 196 respectively. The students of each class are to be divided into groups of the same number of students. Each group can have a paid guide. What is the maximum number of students there can be in each group ? Why do you think each group should have the maximum possible number of students?
Concept: undefined >> undefined
Advertisements
At the Rice Research Centre at Tumsar, there are 2610 kg of seeds of the basmati variety and 1980 kg of the Indrayani variety. If the maximum possible weight of seeds has to be filled to make bags of equal weight what should be the weight of each bag? How many bags of each variety will there be?
Concept: undefined >> undefined
This bar graph shows the maximum temperatures in degrees Celsius in different cities on a certain day in February. Observe the graph and answer the questions.

- What data is shown on the vertical and the horizontal lines?
- Which city had the highest temperature?
- Which cities had equal maximum temperatures?
- Which cities had a maximum temperature of 30° C?
- What is the difference between the maximum temperatures of Panchgani and Chandrapur?
Concept: undefined >> undefined
The names of the heads of some families in a village and the quantity of drinking water their family consumes in one day are given below. Draw a bar graph for this data.
(Scale: On Y-axis, 1cm = 10 litres of water)
| Name | Ramesh | Shobha | Ayub | Julie | Rahul |
| Litres of water used | 30 litres | 60 litres | 40 litres | 50 litres | 55 litres |
Concept: undefined >> undefined
The names and numbers of animals in a certain zoo are given below. Use the data to make a bar graph. (Scale : on Y - axis, 1cm = 4 animals)
| Animals | Deer | Tiger | Monkey | Rabbit | Peacock |
| Number | 20 | 4 | 12 | 16 | 8 |
Concept: undefined >> undefined
The table below gives the number of children who took part in the various items of the talent show as part of the annual school gathering. Make a bar graph to show this data.
(Scale: on Y-axis, 1cm = 4 children)
| Programme | Theatre | Dance | Vocal music | Instrumental music | One-act plays |
| No. of students | 24 | 40 | 16 | 8 | 4 |
Concept: undefined >> undefined
The number of customers who came to a juice centre for one week is given in the table below. Make two different bar graphs to show this data. (Scale: on Y-axis, 1cm = 10 customers, on Y - axis, 1cm = 5 customers)
| Type of juice | Orange | Pineapple | Apple | Mango | Pomegranate |
| No. of Customers | 50 | 30 | 25 | 65 | 10 |
Concept: undefined >> undefined
Students planted trees in 5 villages of Sangli district. Make a bar graph of this data. (Scale: on Y-axis, 1cm = 100 trees)
| Name of place | Dudhgaon | Bagni | Samdoli | Ashta | Kavathepiran |
| No. of trees planted | 500 | 350 | 600 | 420 | 540 |
Concept: undefined >> undefined
Yashwant gives different amounts of time as shown below, to different exercises he does during the week. Draw a bar graph to show the details of his schedule using an appropriate scale.
| Type of exercise | Running | Yogasanas | Cycling | Mountaineering | Badminton |
| Time | 35 Minutes | 50 minutes | 1 hr 10 min | `1 1/2` hours | 45 minutes |
Concept: undefined >> undefined
Write the names of four of your classmates. Beside each name, write his/her weight in kilograms. Enter this data in a table like the above and make a bar graph.
Concept: undefined >> undefined
Subtract:`3 2/5 – 2 1/7`
Concept: undefined >> undefined
Subtract: `7 1/2 – 3 1/5`
Concept: undefined >> undefined
There are 20 kg of jowar and 50 kg of wheat in a shop. All the grain is to be packed in bags. If all the bags are to have equal weights of grain, what is the maximum weight of grain that can be filled in each bag?
Concept: undefined >> undefined
What fractions do the points A and B show on the number line below?
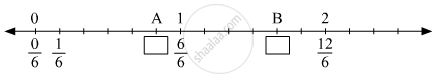
Concept: undefined >> undefined
What fractions do the points A and B show on the number line below?
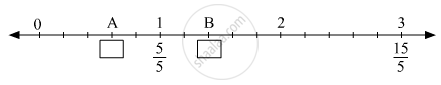
Concept: undefined >> undefined
What fractions do the points A and B show on the number line below?
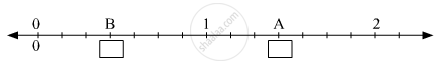
Concept: undefined >> undefined
Show the following fractions on the number line:
`3/5,6/5,2 3/5`
Concept: undefined >> undefined
Show the following fractions on the number line:
`3/4,5/4,2 1/4`
Concept: undefined >> undefined
There are some flowering trees in a garden. Each tree bears many flowers with the same number printed on it. Three children took a basket each to pick flowers. Each basket has one of the numbers, 3, 4 or 9 on it. Each child picks those flowers which have numbers divisible by the number on his or her basket. He/She takes only 1 flower from each tree. Can you tell which numbers the flowers in each basket will have?
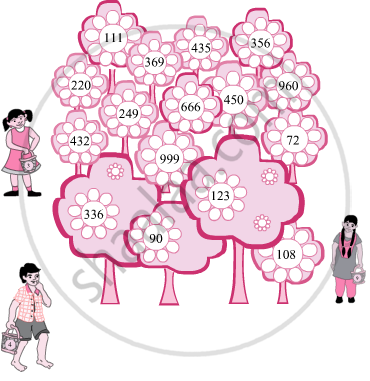
Concept: undefined >> undefined
