Advertisements
Advertisements
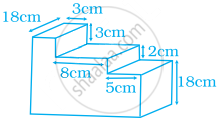
Find the area of the shaded portion in the following figure.

Concept: undefined >> undefined
Find the volume of the given figure if volume = base area × height.
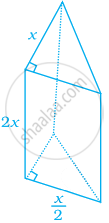
Concept: undefined >> undefined
Advertisements
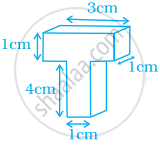
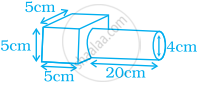
Find the volume of the given figure if volume = base area × height.

Concept: undefined >> undefined
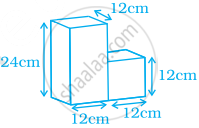
Find the volume of the given figure if volume = base area × height.

Concept: undefined >> undefined
Work out the surface area of following shape (use π = 3.14).
Concept: undefined >> undefined
Work out the surface area of following shape (use π = 3.14).
Concept: undefined >> undefined
Work out the surface area of following shape (use π = 3.14).
Concept: undefined >> undefined
Work out the surface area of following shape (use π = 3.14).
Concept: undefined >> undefined
Comparison of parts of a whole may be done by a ______.
Concept: undefined >> undefined
The graph shows the maximum temperatures recorded for two consecutive weeks of a town. Study the graph and answer the questions that follow.

- What information is given by the two axes?
- In which week was the temperature higher on most of the days?
- On which day was the temperature same in both the weeks?
- On which day was the difference in temperatures the maximum for both the weeks?
- What were the temperatures for both the weeks on Thursday?
- On which day was the temperature 35°C for the first week?
- On which day was the temperature highest for the second week?
Concept: undefined >> undefined
The graph given below gives the actual and expected sales of cars of a company for 6 months. Study the graph and answer the questions that follow.

- In which month was the actual sales same as the expected sales?
- For which month(s) was (were) the difference in actual and expected sales the maximum?
- For which month(s) was (were) the difference in actual and expected sales the least?
- What was the total sales of cars in the months–Jan, Feb. and March?
- What is the average sales of cars in the last three months?
- Find the ratio of sales in the first three months to the last three months
Concept: undefined >> undefined
The graph given below shows the marks obtained out of 10 by Sonia in two different tests. Study the graph and answer the questions that follow.

- What information is represented by the axes?
- In which subject did she score the highest in Test I?
- In which subject did she score the least in Test II?
- In which subject did she score the same marks in both the Tests?
- What are the marks scored by her in English in Test II?
- In which test was the performance better?
- In which subject and which test did she score full marks?
Concept: undefined >> undefined
The following chart gives the growth in height in terms of percentage of full height of boys and girls with their respective ages.
| Age (in years) | 8 | 9 | 10 | 11 | 12 | 13 | 14 | 15 | 16 | 17 |
18 |
| Boys | 72% | 75% | 78% | 81% | 84% | 88% | 92% | 95% | 98% | 99% | 100% |
| Girls | 77% | 81% | 84% | 88% | 91% | 95% | 98% | 99% | 99.5% | 100% | 100% |
Draw the line graph of above data on the same sheet and answer the following questions.
- In which year both the boys and the girls achieve their maximum height?
- Who grows faster at puberty (14 years to 16 years of age)?
Concept: undefined >> undefined
Generalised form of a four-digit number abdc is ______.
Concept: undefined >> undefined
Generalised form of a two-digit number xy is ______.
Concept: undefined >> undefined
The usual form of 1000a + 10b + c is ______.
Concept: undefined >> undefined
The sum of all the numbers formed by the digits x, y and z of the number xyz is divisible by ______.
Concept: undefined >> undefined
If 5A + B3 = 65, then the value of A and B is ______.
Concept: undefined >> undefined
Construct the following quadrilaterals.
Quadrilateral ABCD
AB = 4.5 cm
BC = 5.5 cm
CD = 4 cm
AD = 6 cm
AC = 7 cm
Concept: undefined >> undefined
Construct the following quadrilaterals.
Quadrilateral JUMP
JU = 3.5 cm
UM = 4 cm
MP = 5 cm
PJ = 4.5 cm
PU = 6.5 cm
Concept: undefined >> undefined
