Advertisements
Advertisements
Study the following figures and answer the following questions.
- Which seasons are shown in these maps?
- What is the value of the highest isobar in Figure A and through which part of the country does it pass?
- What are the values of the highest and the lowest isobars in Figure B and where are they located?
- What are the patterns of temperature distribution in both the maps?
- In which parts do you see the highest and the lowest mean temperature in Figure A?
- What relationship do you see between the distribution of temperature and pressure in both the maps?
Figure A
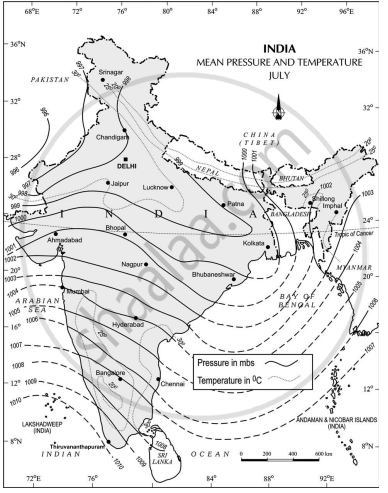
Figure B

Concept: undefined >> undefined
Which one of the following was the purpose of Project Tiger?
Concept: undefined >> undefined
Advertisements
How can people’s participation be effective in conserving forests and wildlife?
Concept: undefined >> undefined
What are the basic requirements for the formation of a cyclone?
Concept: undefined >> undefined
How do you distinguish between the process of soil formation and soil-forming factors?
Concept: undefined >> undefined
What is the role of climate and biological activity as two important control factors in the formation of soils?
Concept: undefined >> undefined
What are conventional signs?
Concept: undefined >> undefined
Which of the following is not used in visual interpretation technique?
Concept: undefined >> undefined
Why is remote sensing a better technique than other traditional methods?
Concept: undefined >> undefined
Lines connecting the places of equal pressure are called______.
Concept: undefined >> undefined
What are Isotherms?
Concept: undefined >> undefined
Which meteorological symbols are used to mark the following on a weather map?
- Rain
- Mist
- Sunshine
- Lightning
- Overcast Sky
Concept: undefined >> undefined
Which one of the following states of India experiences floods frequently?
Concept: undefined >> undefined
Which one of the following states receives floods in the winter months?
Concept: undefined >> undefined
In which of the following rivers is the Majuli River Island situated?
Concept: undefined >> undefined
How are the floods in Eastern India different from the ones in Western India?
Concept: undefined >> undefined
Why are there more droughts in Central and Western India?
Concept: undefined >> undefined
Write short note on ‘Marginal Information’ in Topographical sheets.
Concept: undefined >> undefined
If you are interpreting the cultural features from a topographical sheet, what information would you like to seek and how would you derive this information? Discuss with the help of suitable examples.
Concept: undefined >> undefined
Study the extract for topographical sheet 63K/12 shown in the figure below and answer the following questions.
- Give the height of the highest point on the map.
- River Jamtihwa Nadi is flowing through which quarter of the map?
- Which is the major settlement located in the east of the Kuardari Nala?
- What type of settlement does the area have?
- Name the geographical feature represented by white patches in the middle of Sipu Nadi.
- Name the two types of vegetation shown on part of the topographical sheet.
- What is the direction of the flow of the Kuardari?
- In which part of the sheet area is Lower Khajuri Dam located?
 R. F. 1: 50,000
Part of the Topographical Sheet No 63K/12
Concept: undefined >> undefined
