Advertisements
Advertisements
Question
With the help of given statistical data prepare a simple bar graph and answer the following questions:
India – Trend of Urbanisation (1961-2011)
| Year | Percentage of Urban Population |
| 1961 | 18.0 |
| 1971 | 18.2 |
| 1981 | 23.3 |
| 1991 | 25.7 |
| 2001 | 27.8 |
| 2011 | 31.2 |
- What is the interval of the data?
- Which decade shows slow rate of urbanisation?
- Which decade shows high rate of urbanisation?
Graph
Very Short Answer
Advertisements
Solution
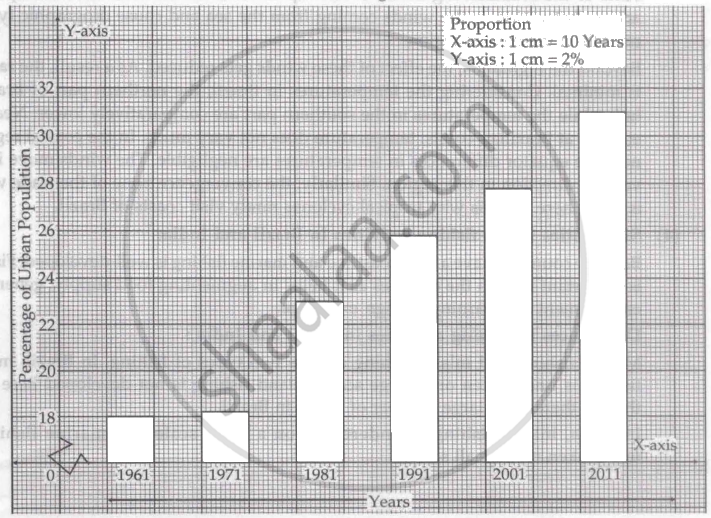
- The interval of the data is ten years.
- The decade that shows the slowest rate of urbanization is 1961-1971.
- The decade that shows the highest rate of urbanization is 1971-1981.
shaalaa.com
Is there an error in this question or solution?
