Advertisements
Advertisements
Question
Why do some states of India have higher rates of work participation than others?
Advertisements
Solution
The work participation rate is the number of people engaged in economic activities. Some states of India like Himachal Pradesh, Sikkim, Chhattisgarh, Andhra Pradesh, etc. tend to have higher work participation rates. The work participation rate tends to be higher in the areas of lower levels of economic development since the number of manual workers is needed to perform the subsistence or near subsistence economic activities in the absence of other opportunities.
APPEARS IN
RELATED QUESTIONS
Write a short note on literacy rate.
Differentiate between:
Expansive population pyramid and Constrictive population pyramid.
Answer in detail :
Outline the importance of population pyramids in the study of populations.
Broad base with narrowing apex shows that more people die at each higher band. It shows ______.
Ratio of males and females in the population is ______.
Identify the incorrect factor
Pull factors of migration:
Differentiate between
Quaternary occupations and Quinary occupations
Observe the following graph and answer the question given below:

Questions:
- Which pyramid(s) represent(s) a country with high medical expenditure?
- Which pyramid(s) represent(s) a country with a large manpower?
- In which pyramid(s) the number of old people will be the least?
- What is the reason of the broad shape of A pyramid?
- Why C pyramid looks vertical in shape?
Observe the following graph and answer the question given below:

Question:
- Which type of the graph shown above?
- In which age group male percentage is highest?
- In which age group female percentage is lowest?
- Whose percentage is highest in 30-39 age group?
- In which age group female percentage is higher than male percentage?
Which one of the following states has the highest proportion of the urban population in India according to the 2001 Census?
Which one of the following figures represents the working age group of the population?
Which one of the following countries has the highest sex ratio in the world?
What do you mean by natural advantage and social disadvantage?
How does the sex ratio give important information about the status of women in a country?
Bell shaped Pyramid refers to ______.
Which one of the following countries has the highest sex ratio in the world?
According to the UNO, how many countries have sex ratio unfavourable for females?
Which country’s population shows a constant population?
Study the given graph carefully and answer the following question:
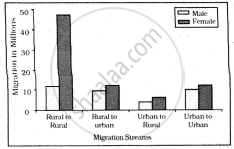
Intra-state Migration by place of Last Residence Indicating Migration Streams India, 2011
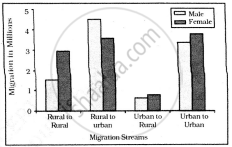
Inter-state Migration by Place of Last Residence Indicating Migration Streams India, 2011
Who dominates rural to rural migration in inter-state migration?
Sex ratio in the world is calculated as?
The lowest sex ratio in the world is in which country?
Which group is also known as post-reproductive group?
Identify the correct group or factor.
Which one of the following is the largest linguistic group of India?
Write a short note on:
Demographic dividend.
Which one of the following is the largest linguistic group of India?
Which one of the following is the largest linguistic group of India?
Which one of the following is the largest linguistic group of India?
Which one of the following is the largest linguistic group of India?
Which one of the following is the largest linguistic group of India?
