Advertisements
Advertisements
Question
Which amongst the following options is the correct graphical representation of Boyle’s law?
Options
MCQ
Advertisements
Solution
Explanation:
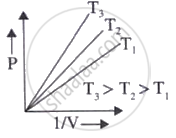
According to the question, Boyle’s law is defined at a constant temperature for an ideal gas.
`P ∝ 1/V`
P = (nRT), `(1/v)` [Straight-line equation]
Slope of P versus `1/v` curve is nRT.
An increase in the slope of the graph indicates an increase in the temperature (T).
∴ T3 > T2 > T
shaalaa.com
Is there an error in this question or solution?
