Advertisements
Advertisements
Question
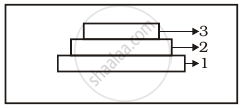
What type of population growth is represented by the above age pyramid?
One Word/Term Answer
Advertisements
Solution
Expanding population
shaalaa.com
Is there an error in this question or solution?
What type of population growth is represented by the above age pyramid?
Expanding population
