Advertisements
Advertisements
Question
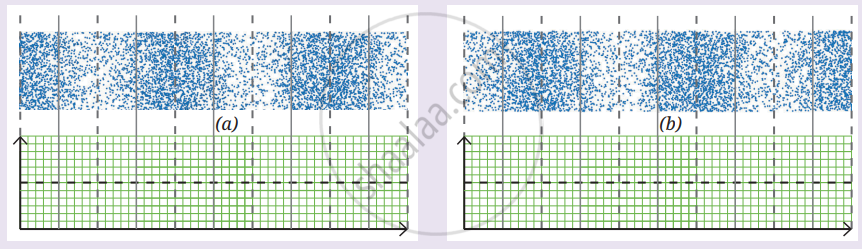
The variation of density of the medium for two sound waves is shown in Fig. (a) and (b). Label compression and rarefaction by C and R on it. In the graph given in Fig. (c) and (d), label the axes and draw the curves corresponding to Fig. (a) and (b).
Short Answer
Advertisements
Solution
- Fig. (a) and (b): Label the regions of high density as C (Compression) and low density as R (Rarefaction).
- Fig. (c) and (d): Draw the corresponding density–distance graphs.
-
- X-axis: Distance
- Y-axis: Density
- Crests: Compressions (C)
- Troughs: Rarefactions (R)
- Dashed horizontal line: Average density
shaalaa.com
Is there an error in this question or solution?
