Advertisements
Advertisements
Question
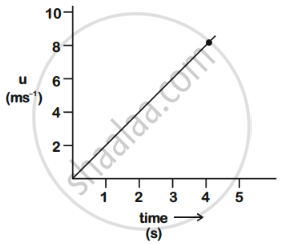
The speed versus time graph for a particle is shown in the figure. The distance travelled (in m) by the particle during the time interval t = 0 to t = 5 s will be ______.
Options
20
30
40
50
MCQ
Fill in the Blanks
Advertisements
Solution
The speed versus time graph for a particle is shown in the figure. The distance travelled (in m) by the particle during the time interval t = 0 to t = 5 s will be 20.
Explanation:
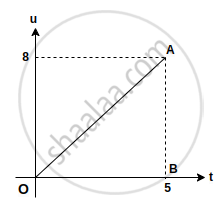
Distance travelled = Area of speed-time graph
= `1/2xx5xx8`
= 20 m
shaalaa.com
Is there an error in this question or solution?
