English

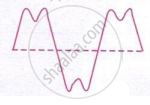
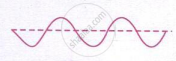
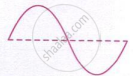
The sketches I to IV in Fig. show sound waves, all formed in the same time interval. Which diagram shows a note from a musical instrument?
Advertisements
Advertisements

Question

The sketches I to IV in Fig. show sound waves, all formed in the same time interval. Which diagram shows a note from a musical instrument? 
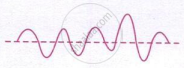

  1. The image shows a transverse wave oscillating about its mean position, indicated by the dashed horizontal line.

  2.  The image shows one complete transverse wave cycle oscillating about its mean position, indicated by the dashed horizontal line.

  3. The image shows an irregular transverse wave oscillating about its mean position, indicated by the dashed horizontal line.

  4. The image shows an irregular wave with varying amplitude, oscillating about the mean position shown by the dashed horizontal line.

Options

  • I

  • II

  • III

  • IV

MCQ
Advertisements

Solution

IV

Explanation:

A musical note has a regular and periodic waveform. Diagram IV represents a complex periodic wave produced by a musical instrument. Diagram III is irregular and represents noise, while I and II are simple periodic waves rather than the musical-note waveform intended here.

shaalaa.com
  Is there an error in this question or solution?
Chapter 3: Sound - Multiple Choice Questions and Assertion-Reason Type Questions [Page 214]

APPEARS IN

Frank Physics Part 2 [English] Class 10 ICSE
Chapter 3 Sound
Multiple Choice Questions and Assertion-Reason Type Questions | Q 21. | Page 214
Share
Notifications

Englishहिंदीमराठी


      Forgot password?
Use app×