Advertisements
Advertisements
Question
The sales of salesmen in a week are given in the pie diagram. Study the diagram and answer the following questions. If the total sale due to salesmen A is Rs. 18,000, then
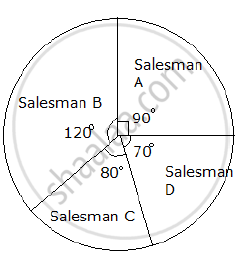
a) Find the total sale.
b) Find the sale of each salesman.
c) Find the salesman with the highest sale.
d) Find the difference between the highest sale and the lowest sale.
Advertisements
Solution
a) Total Sales of salesman A = Rs. 18000
`"Sales of salesman A"=" Central angle"/(360°) xx "total sale"`
⇒ `18000=(90°)/(360°)xx "Total sales"`
⇒ `"Total sale" = (18000 xx 360)/90`
⇒ Total sale = Rs. 72,000
b) `"Sales of salesman B"=" Central angle"/(360°) xx"total sale"`
`"Sales of salesman B"=(120°)/(360°)xx72000`
`"Sales of salesman B"="Rs".24000`
`"Sales of salesman c"="Central angle"/(360°)xx"Total sales "`
`"Sales of salesman C"=(80°)/(360°)xx72000`
`"Sales of salesman C"= "Rs."16000`
`"Sales of salesman D"="Central angle"/(360°)xx"Total sales "`
`"Sales of salesman D"=(70°)/(360°)xx72000`
`"Sales of salesman C"= "Rs."14000`
c) Salesman B has the highest sale of Rs 24,000.
d) Highest sale = Rs. 24,000
Lowest sale = Rs. 14,000
∴ Difference between the highest sale and the lowest sale = 24000 − 14000 = Rs. 10,000.
