Advertisements
Advertisements
Question
The production yield per hectare of wheat of some farms of a village are given in the following table:
| Production yield (in kg/ha) |
40 – 45 | 45 – 50 | 50 – 55 | 55 – 60 | 60 – 65 | 65 – 70 | 70 – 75 | 75 – 80 | 80 – 85 |
| Number of farms |
1 | 9 | 15 | 18 | 40 | 26 | 16 | 14 | 10 |
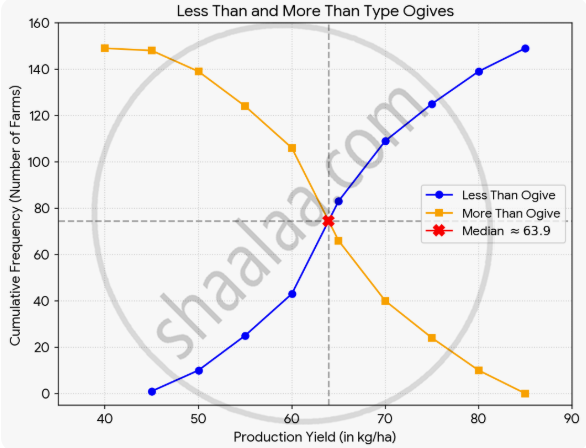
Draw a less than type ogive and a more than type ogive for this data.
Graph
Sum
Advertisements
Solution
1. Less than type cumulative frequency table
For a less than ogive, we plot the upper class limits on the x-axis and their corresponding less than cumulative frequencies on the y-axis.
| Production yield (Upper Limit) |
Number of farms (Frequency) |
Less than Cumulative Frequency (cf) |
Plotting points (x, y) |
| Less than 45 | 1 | 1 | (45, 1) |
| Less than 50 | 9 | 1 + 9 = 10 | (50, 10) |
| Less than 55 | 15 | 10 + 15 = 25 | (55, 25) |
| Less than 60 | 18 | 25 + 18 = 43 | (60, 43) |
| Less than 65 | 40 | 43 + 40 = 83 | (65, 83) |
| Less than 70 | 26 | 83 + 26 = 109 | (70, 109) |
| Less than 75 | 16 | 109 + 16 = 125 | (75, 125) |
| Less than 80 | 14 | 125 + 14 = 139 | (80, 139) |
| Less than 85 | 10 | 139 + 10 = 149 | (85, 149) |
2. More than type cumulative frequency table
For a more than ogive, we plot the lower class limits on the x-axis and their corresponding more than cumulative frequencies on the y-axis.
| Production yield (Lower Limit) |
Number of farms (Frequency) |
More than Cumulative Frequency (cf) |
Plotting Points (x, y) |
| More than or equal to 40 |
1 | 149 | (40, 149) |
| More than or equal to 45 |
9 | 149 – 1 = 148 | (45, 148) |
| More than or equal to 50 |
15 | 148 – 9 = 139 | (50, 139) |
| More than or equal to 55 |
18 | 139 – 15 = 124 | (55, 124) |
| More than or equal to 60 |
40 | 124 – 18 = 106 | (60, 106) |
| More than or equal to 65 |
26 | 106 – 40 = 66 | (65, 66) |
| More than or equal to 70 |
16 | 66 – 26 = 40 | (70, 40) |
| More than or equal to 75 |
14 | 40 – 16 = 24 | (75, 24) |
| More than or equal to 80 |
10 | 24 – 14 = 10 | (80, 10) |
| More than or equal to 85 |
- | 0 | (85, 0) |
3. Ogive Graph
Below is the visual representation of both the Less Than and More Than type ogives plotted on the same axes. The point where both curves intersect gives the median of the data.
shaalaa.com
Is there an error in this question or solution?
