Advertisements
Advertisements
Question
The pie chart on the right shows the result of a survey carried out to find the modes of travel used by the children to go to school. Study the pie chart and answer the questions that follow.
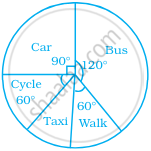
- What is the most common mode of transport?
- What fraction of children travel by car?
- If 18 children travel by car, how many children took part in the survey?
- How many children use taxi to travel to school?
- By which two modes of transport are equal number of children travelling?
Advertisements
Solution
a. The central angle is maximum for bus, hence bus is the most common mode of transport.
b. Fraction of children travelled by car = `"Central angle"/360^circ`
= `90^circ/360^circ`
= `1/4`
c. We know that, fraction of children travel by car = `1/4`
Hence, total number of children travelled by car = `1/4` × Total number of children
⇒ 18 = `1/4` × Total number of children
Total number of children = 18 × 4 = 72
d. The central angle made up the sectors representing cycle and walk are same.
Hence, the cycle and walk are two modes of transport, by which equal number of children are travelling.
