Advertisements
Advertisements
Question
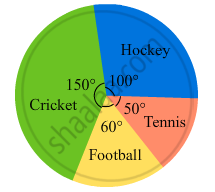
The pie chart (as shown in the figure 25.23) represents the amount spent on different sports by a sports club in a year. If the total money spent by the club on sports is Rs 1,08,000, find the amount spent on each sport.
Advertisements
Solution
\[\text{ Amount spent on cricket }= \frac{\text{ Central angle of the corresponding sector }\times \text{ Total Money spent }}{360^\circ}\]
\[ = \frac{150^\circ \times 108000}{360^\circ} = Rs 45, 000\]
\[\text{ Amount spent on hockey }= \frac{\text{ Central angle of the corresponding sector }\times\text{ Total Money spent }}{360^\circ}\]
\[ = \frac{100^\circ \times 108000}{360^\circ} = Rs 30, 000\]
\[\text{ Amount spent on football }= \frac{\text{ Central angle of the corresponding sector }\times\text{ Total Money spent }}{360^\circ}\]
\[ = \frac{60^\circ \times 108000}{360^\circ} = Rs 18, 000\]
\[\text{ Amount spent on tennis }= \frac{\text{ Central angle of the corresponding sector }\times\text{ Total Money spent }}{360^\circ}\]
\[ = \frac{50^\circ \times 108000}{360^\circ} = Rs 15, 000\]
