Advertisements
Advertisements
Question
The heights of 50 girls of Class X of a school are recorded as follows:
| Height (in cm) | 135 – 140 | 140 – 145 | 145 – 150 | 150 – 155 | 155 – 160 | 160 – 165 |
| No of Students | 5 | 8 | 9 | 12 | 14 | 2 |
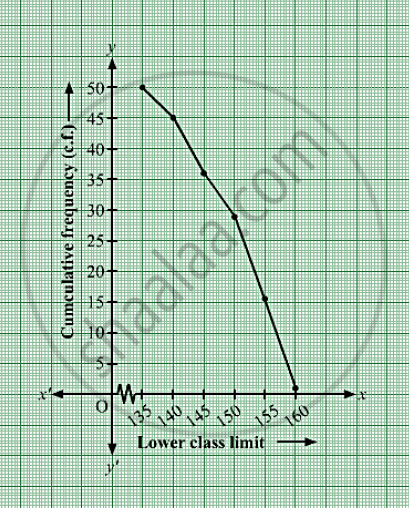
Draw a ‘more than type’ ogive for the above data.
Graph
Sum
Advertisements
Solution
The frequency distribution table of more than type is as follows:
| Height (in cm) (lower class limit | Cumulative frequency (cf) |
| More than 135 | 5 + 45 = 50 |
| More than 140 | 8 + 37 = 45 |
| More than 145 | 9 + 28 = 37 |
| More than 150 | 12 + 16 = 28 |
| More than 155 | 14 + 2 = 16 |
| More than 160 | 2 |
Taking lower class limits of on x-axis and their respective cumulative frequencies on y-axis,its ogive can be drawn as follows:
shaalaa.com
Is there an error in this question or solution?
