Advertisements
Advertisements
Question
The great German naturalist and geographer Alexander Von Humboldt observed that within a region species richness increased with increasing explored area, but only upto a limit.
- For the above situation, construct a graph and write an equation.
- Also write various values of Z (regression coefficient).
Advertisements
Solution
a. Graph and equation:
Alexander Von Humboldt noted that there is a logarithmic relationship between species richness (S) and the investigated area (A). The species-area curve on the graph indicates that species richness rises but decreases with the investigated area.
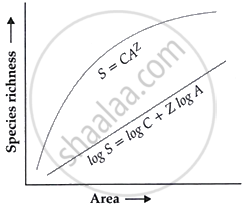
The equation for this relationship is:
S = CAZ
Where:
S = Species richness
C = A constant (specific to the ecosystem)
A = Area explored
Z = Regression coefficient (slope of the log-log graph)
Graph representation:
The curve shows a saturation point where increasing area produces a minor increase in species richness. It begins steeply but levels off as the area grows.
b. Various Values of Z (Regression Coefficient)
The value of Z varies depending on the type of ecosystem:
| Ecosystem type | Value of Z |
| Small areas within a single region (e.g., a forest) | 0.1-0.2 |
| Large areas across a continent | 0.6-1.2 |
| Entire continents (Fruit eating birds and mammals in the tropical forests) | ∼1.15 (approaching 1) |
- Z between 0.1 and 0.2 indicates a slow rise in species richness with area.
- For a wide area, species richness rises quickly when Z is between 0.6 and 1.2.
- High species turnover across several regions is indicated when Z gets close to 1.
