Advertisements
Advertisements
Question
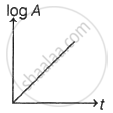
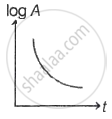
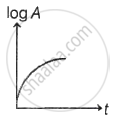
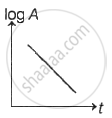
The graph obtained by plotting loge (A) [A is the activity of a radioactive sample] against t (time) out of the following is:
Options
MCQ
Advertisements
Solution
shaalaa.com
Is there an error in this question or solution?
