Advertisements
Advertisements
Question
The given graph represents the cooling curve of a liquid.
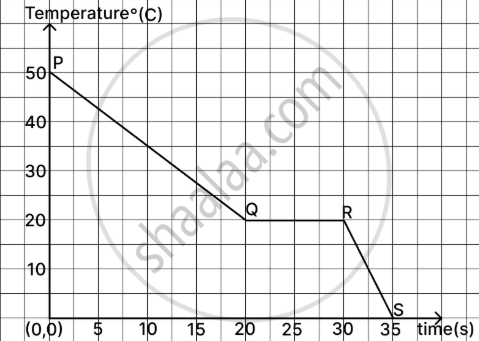
- State the freezing temperature of the liquid.
- Name the phase change happening at the region QR.
- In which state (solid/liquid) does the above substance liberate heat at a faster rate? Justify.
Justify
Long Answer
One Word/Term Answer
Advertisements
Solution
- The liquid’s freezing point is 20°C, as the graph becomes horizontal at this temperature, signifying that the temperature remains constant throughout the phase transition.
- Freezing (liquid changing into solid)
- The substance releases heat faster in the solid state, as shown by the steeper slope of the graph after point R, indicating a greater decrease in temperature relative to the liquid state prior to point Q, when the slope is less significant.
shaalaa.com
Is there an error in this question or solution?
2025-2026 (March) Official Board Paper
