Advertisements
Advertisements
Question
The given distribution shows the number of wickets taken by the bowlers in one-day international cricket matches:
| Number of wickets | Less than 15 | Less than 30 | Less than 45 | Less than 60 | Less than 75 | Less than 90 | Less than 105 | Less than 120 |
| Number of bowlers | 2 | 5 | 9 | 17 | 39 | 54 | 70 | 80 |
Draw a ‘less than type’ ogive from the above data. Find the median.
Graph
Sum
Advertisements
Solution
Taking upper class limits of class intervals on x-axis and their respective frequencies on y-axis, its ogive can be drawn as follows:
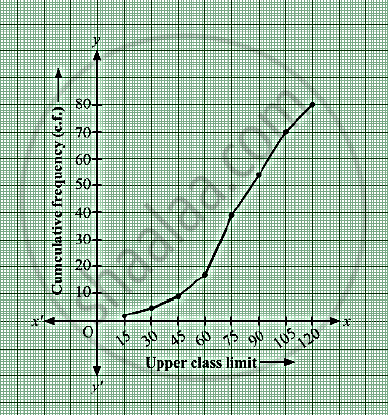
Here, N = 80 ⇒` N/2` = 40.
Mark the point A whose ordinate is 40 and
its x-coordinate is 76.
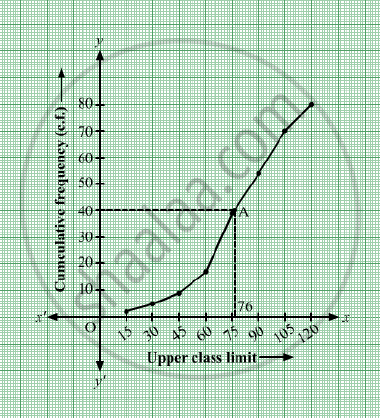
Thus, median of the data is 76.
shaalaa.com
Is there an error in this question or solution?
