Advertisements
Advertisements
Question
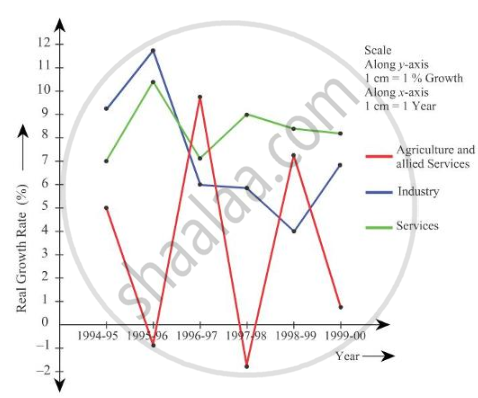
The following table shows the estimated sectoral real growth rates (percentage change over the previous year) in GDP at factor cost.
|
Year |
Agriculture and allied sectors |
Industry |
Services |
|
1994-95 |
5.0 |
9.2 |
7.0 |
|
1995-96 |
-0.9 |
11.8 |
10.3 |
|
1996-97 |
9.6 |
6.0 |
7.1 |
|
1997-98 |
-1.9 |
5.9 |
9.0 |
|
1998-99 |
7.2 |
4.0 |
8.3 |
|
1999-2000 |
0.8 |
6.9 |
8.2 |
Represent the data as multiple time-series graphs.
Graph
Advertisements
Solution
shaalaa.com
Abular Presentation and Diagrammatic Presentation of Data - Arithmetic Line Graphs
Is there an error in this question or solution?
Chapter 4: Presentation of Data - Exercise [Page 57]
