Advertisements
Advertisements
Question
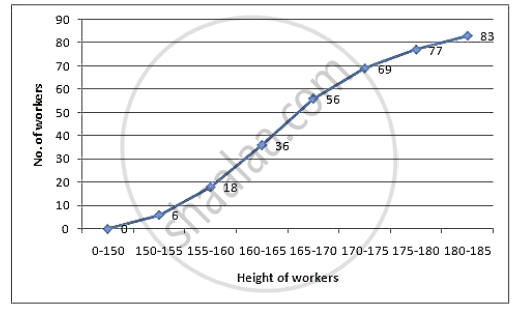
The following table shows the distribution of the heights of a group of factory workers:
| Ht. (cm): | 150-155 | 155-160 | 160-165 | 165-170 | 170-175 | 175-180 | 180-185 |
| No. of workers: | 6 | 12 | 18 | 20 | 13 | 8 | 6 |
- Determine the cumulative frequencies.
- Draw the ‘less than’ cumulative frequency curve on graph paper. Use 2 cm = 5 cm height on one axis and 2 cm = 10 workers on the other.
Graph
Sum
Advertisements
Solution
| Height (in cm) | No. of workers | c.f. |
| 150-155 | 6 | 6 |
| 155-160 | 12 | 18 |
| 160-165 | 18 | 36 |
| 165-170 | 20 | 56 |
| 170-175 | 13 | 69 |
| 175-180 | 8 | 77 |
| 180-185 | 6 | 83 |
We plot the points (155, 6), (160, 18), (165, 36), (170, 56), (175, 69), (180, 77), and (185, 83) on the graph and join them in freehand to obtain an ogive.
shaalaa.com
Is there an error in this question or solution?
